


fig4
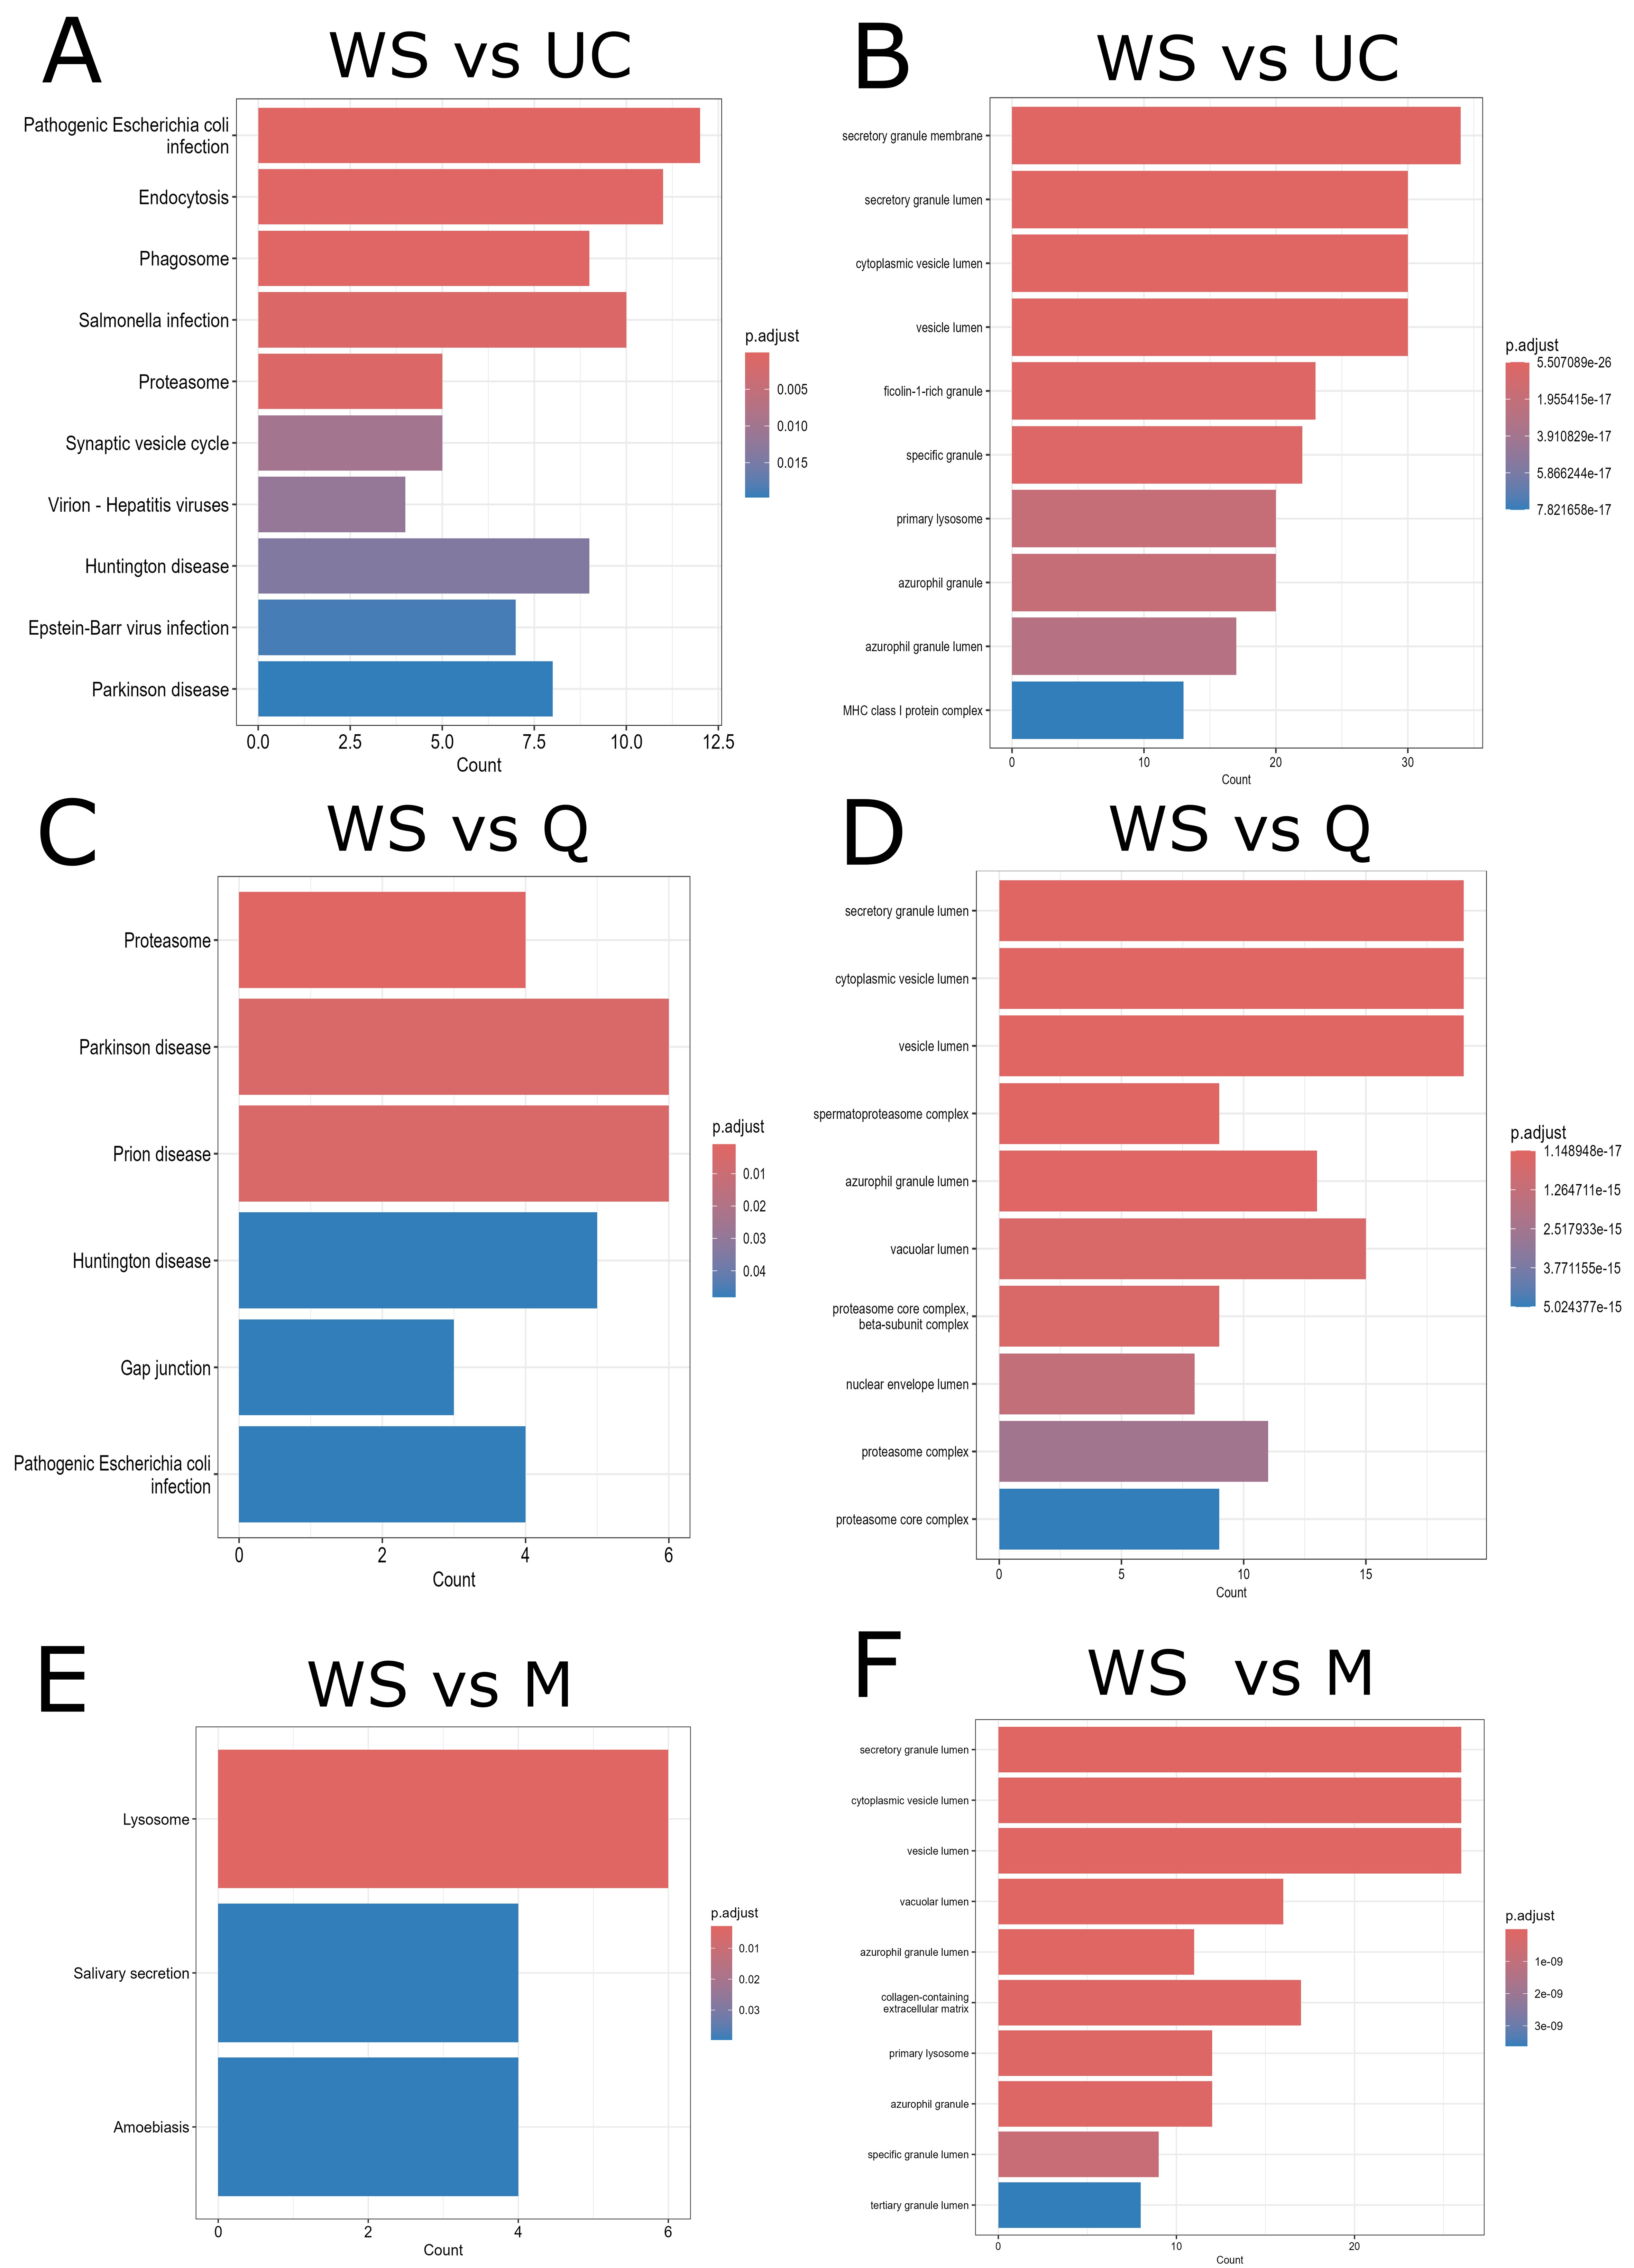
Figure 4. Functional enrichment analysis of differentially abundant proteins between whole saliva and EV fractions. Bar plots illustrate the results of functional enrichment analyses performed using the ClusterProfiler R package (v4.10.1) on proteins differentially abundant between WS and each EV isolation method. (A, C and E) KEGG pathway enrichment for WS vs. UC, WS vs. Q, and WS vs. M, respectively; (B, D and F) GO enrichment analysis (CC category) for WS vs. UC, WS vs. Q, and WS vs. M, respectively. The x-axis indicates the number of proteins associated with each enriched pathway or CC, and the y-axis lists the top enriched terms. Bar color reflects the adjusted P-value (Benjamini-Hochberg), with redder colors indicating greater statistical significance. WS: Whole saliva supernatant; EV: extracellular vesicles; UC: ultracentrifugation; Q: PEG-based co-precipitation; M: immunoaffinity capture; KEGG: Kyoto Encyclopedia of Genes and Genomes; GO: Gene Ontology; BP: biological process; CC: cellular component.


