


fig2
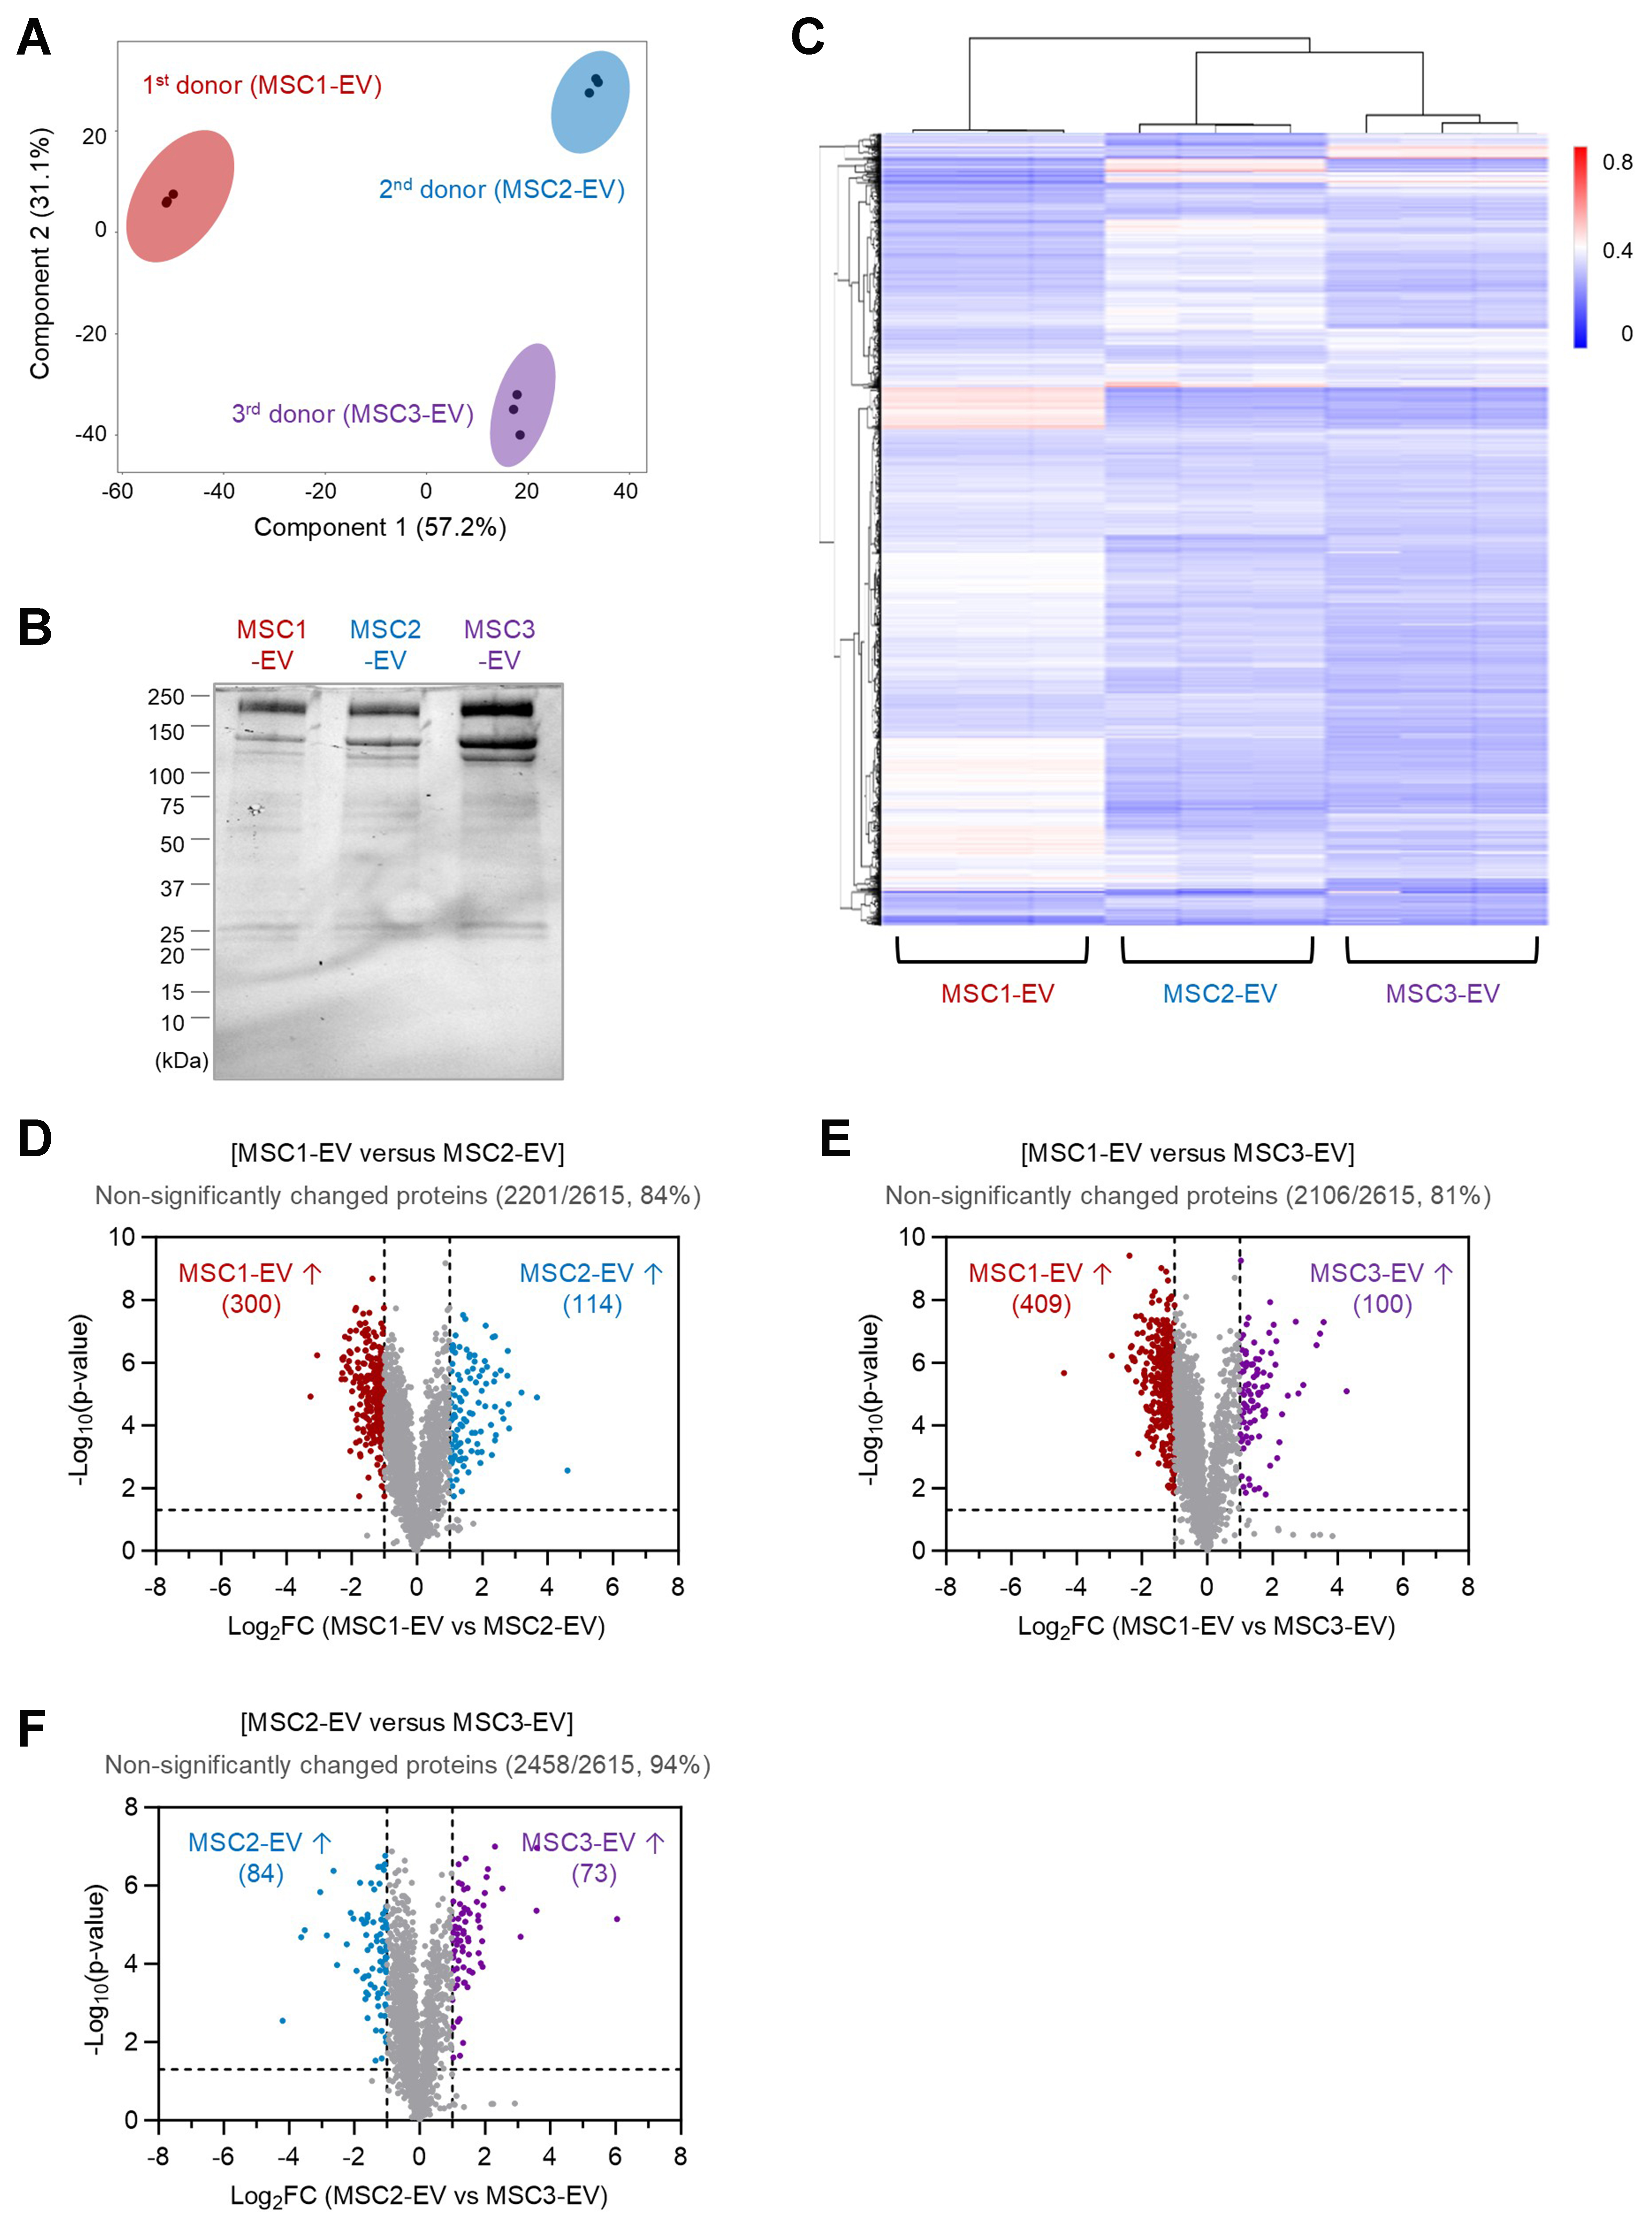
Figure 2. Comparative proteomic analysis of EVs from different MSC donors. (A) PCA of EV proteomes showing clustering of three MSC donor-derived EVs (MSC1-EV, MSC2-EV, and MSC3-EV), each with three replicates; (B) Stain-free SDS-PAGE gel of total EV proteins from all three MSC donors; (C) Partial hierarchical clustering heatmap of relative protein abundances across different EV batches, with each batch represented by three replicates; (D) Volcano plot comparing EV proteomes from different MSC donors (MSC1-EV vs. MSC2-EV), representing 300 proteins significantly enriched in MSC1-EV, 114 proteins in MSC2-EV, and 2,201 proteins unchanged (84% of 2,615 total proteins); (E) Volcano plot comparing EV proteomes from different MSC donors (MSC1-EV vs. MSC3-EV), representing 409 proteins significantly enriched in MSC1-EV, 100 proteins in MSC3-EV, and 2,106 proteins unchanged (81% of 2,615 total proteins); (F) Volcano plot comparing EV proteomes from different MSC donors (MSC2-EV vs. MSC3-EV), representing 84 proteins significantly enriched in MSC2-EV, 73 proteins in MSC3-EV, and 2,458 proteins unchanged (94% of 2,615 total proteins). EVs: Extracellular vesicles; MSC: mesenchymal stem cell; PCA: principal component analysis; SDS-PAGE: sodium dodecyl sulfate-polyacrylamide gel electrophoresis.


