


fig1
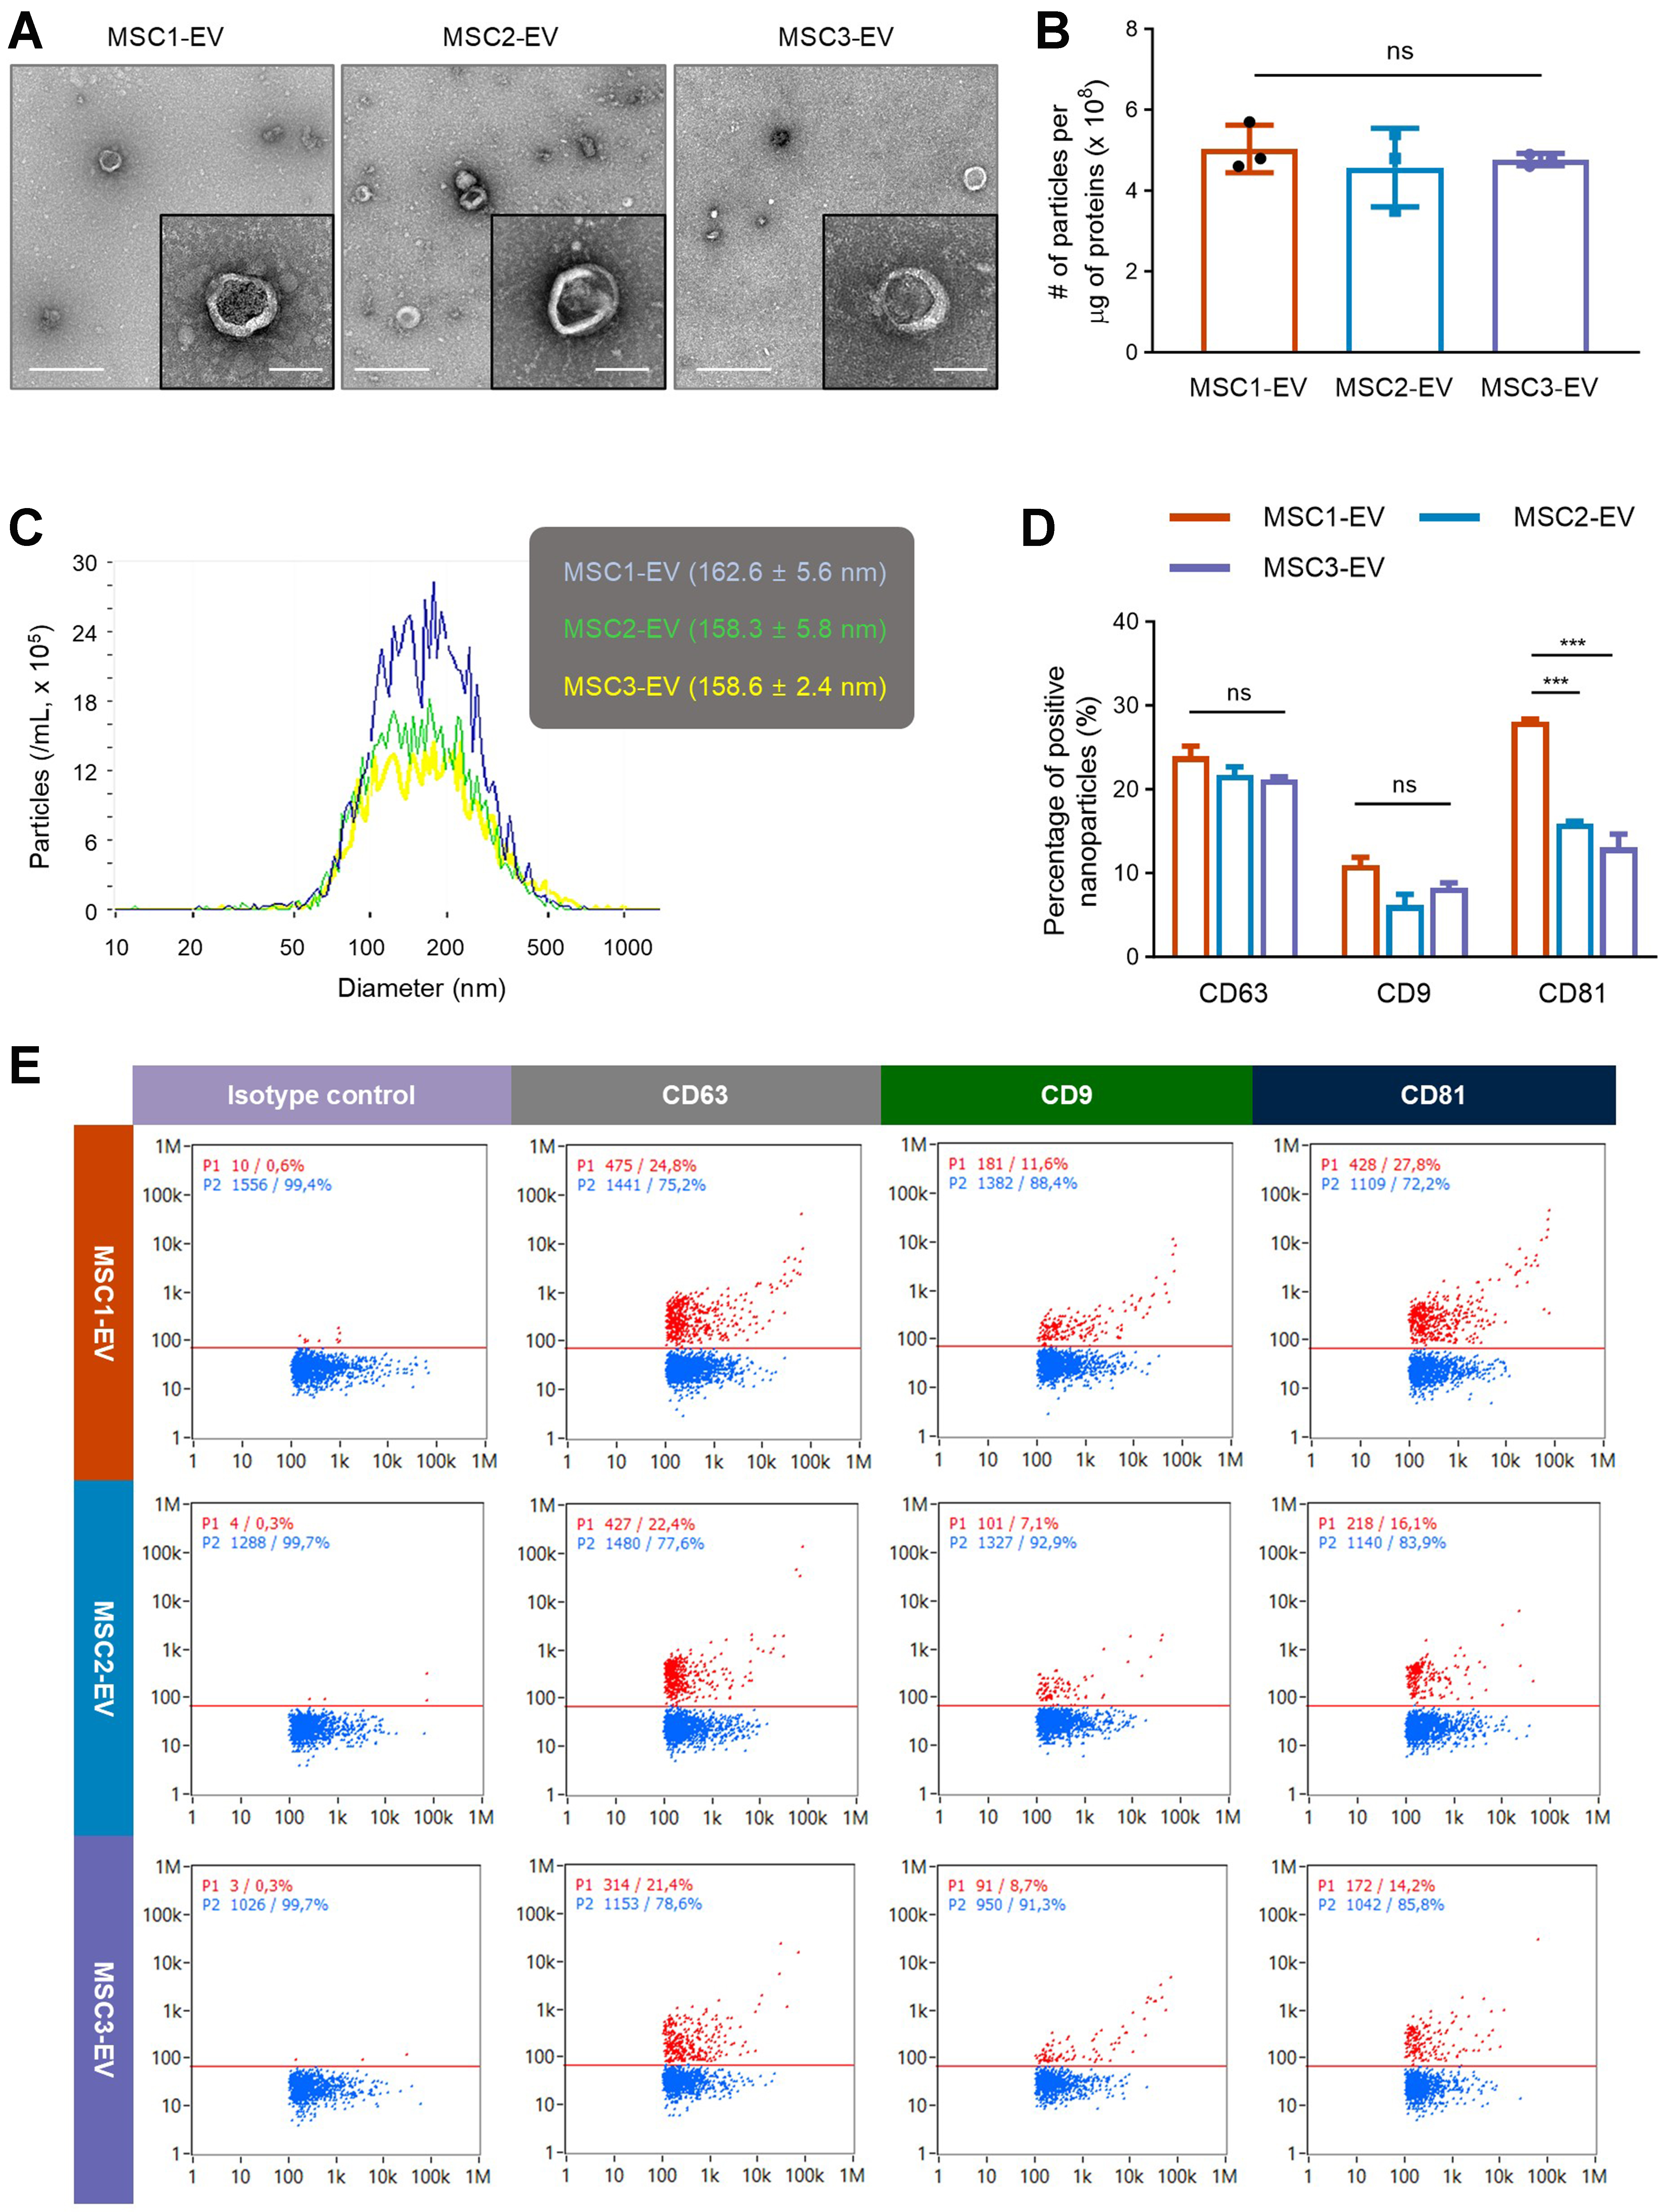
Figure 1. Morphology and marker expression of EVs from different MSC donors. (A) Representative electron microscopy images showing the characteristic vesicular structure across EV batches. The left and right scale bars represent 500 and 100 nm, respectively, in each sample image; (B) The number of particles per one microgram of vesicular proteins (n = 3); (C) The size distribution of different EV batches measured by nanoparticle tracking analysis; (D) Nano-flow cytometry analysis showing the percentage of vesicles positive for CD63, CD9, or CD81 across different EV batches (n = 2); (E) Representative nano-flow cytometry analysis of three EV batches. Scatter plots show particle populations, with red indicating vesicles positive for a specific tetraspanin protein and blue indicating negative vesicles. The X- and Y-axes represent side scatter height and fluorescence intensity, respectively. Throughout, the data are presented as the mean ± SEM. ***P < 0.001; ns, not significant, by one-way ANOVA with Tukey’s post hoc test (B) or two-way ANOVA with Tukey’s post hoc test (D). EVs: Extracellular vesicles; MSC: mesenchymal stem cell; SEM: standard error of the mean; ANOVA: analysis of variance.


