


fig9
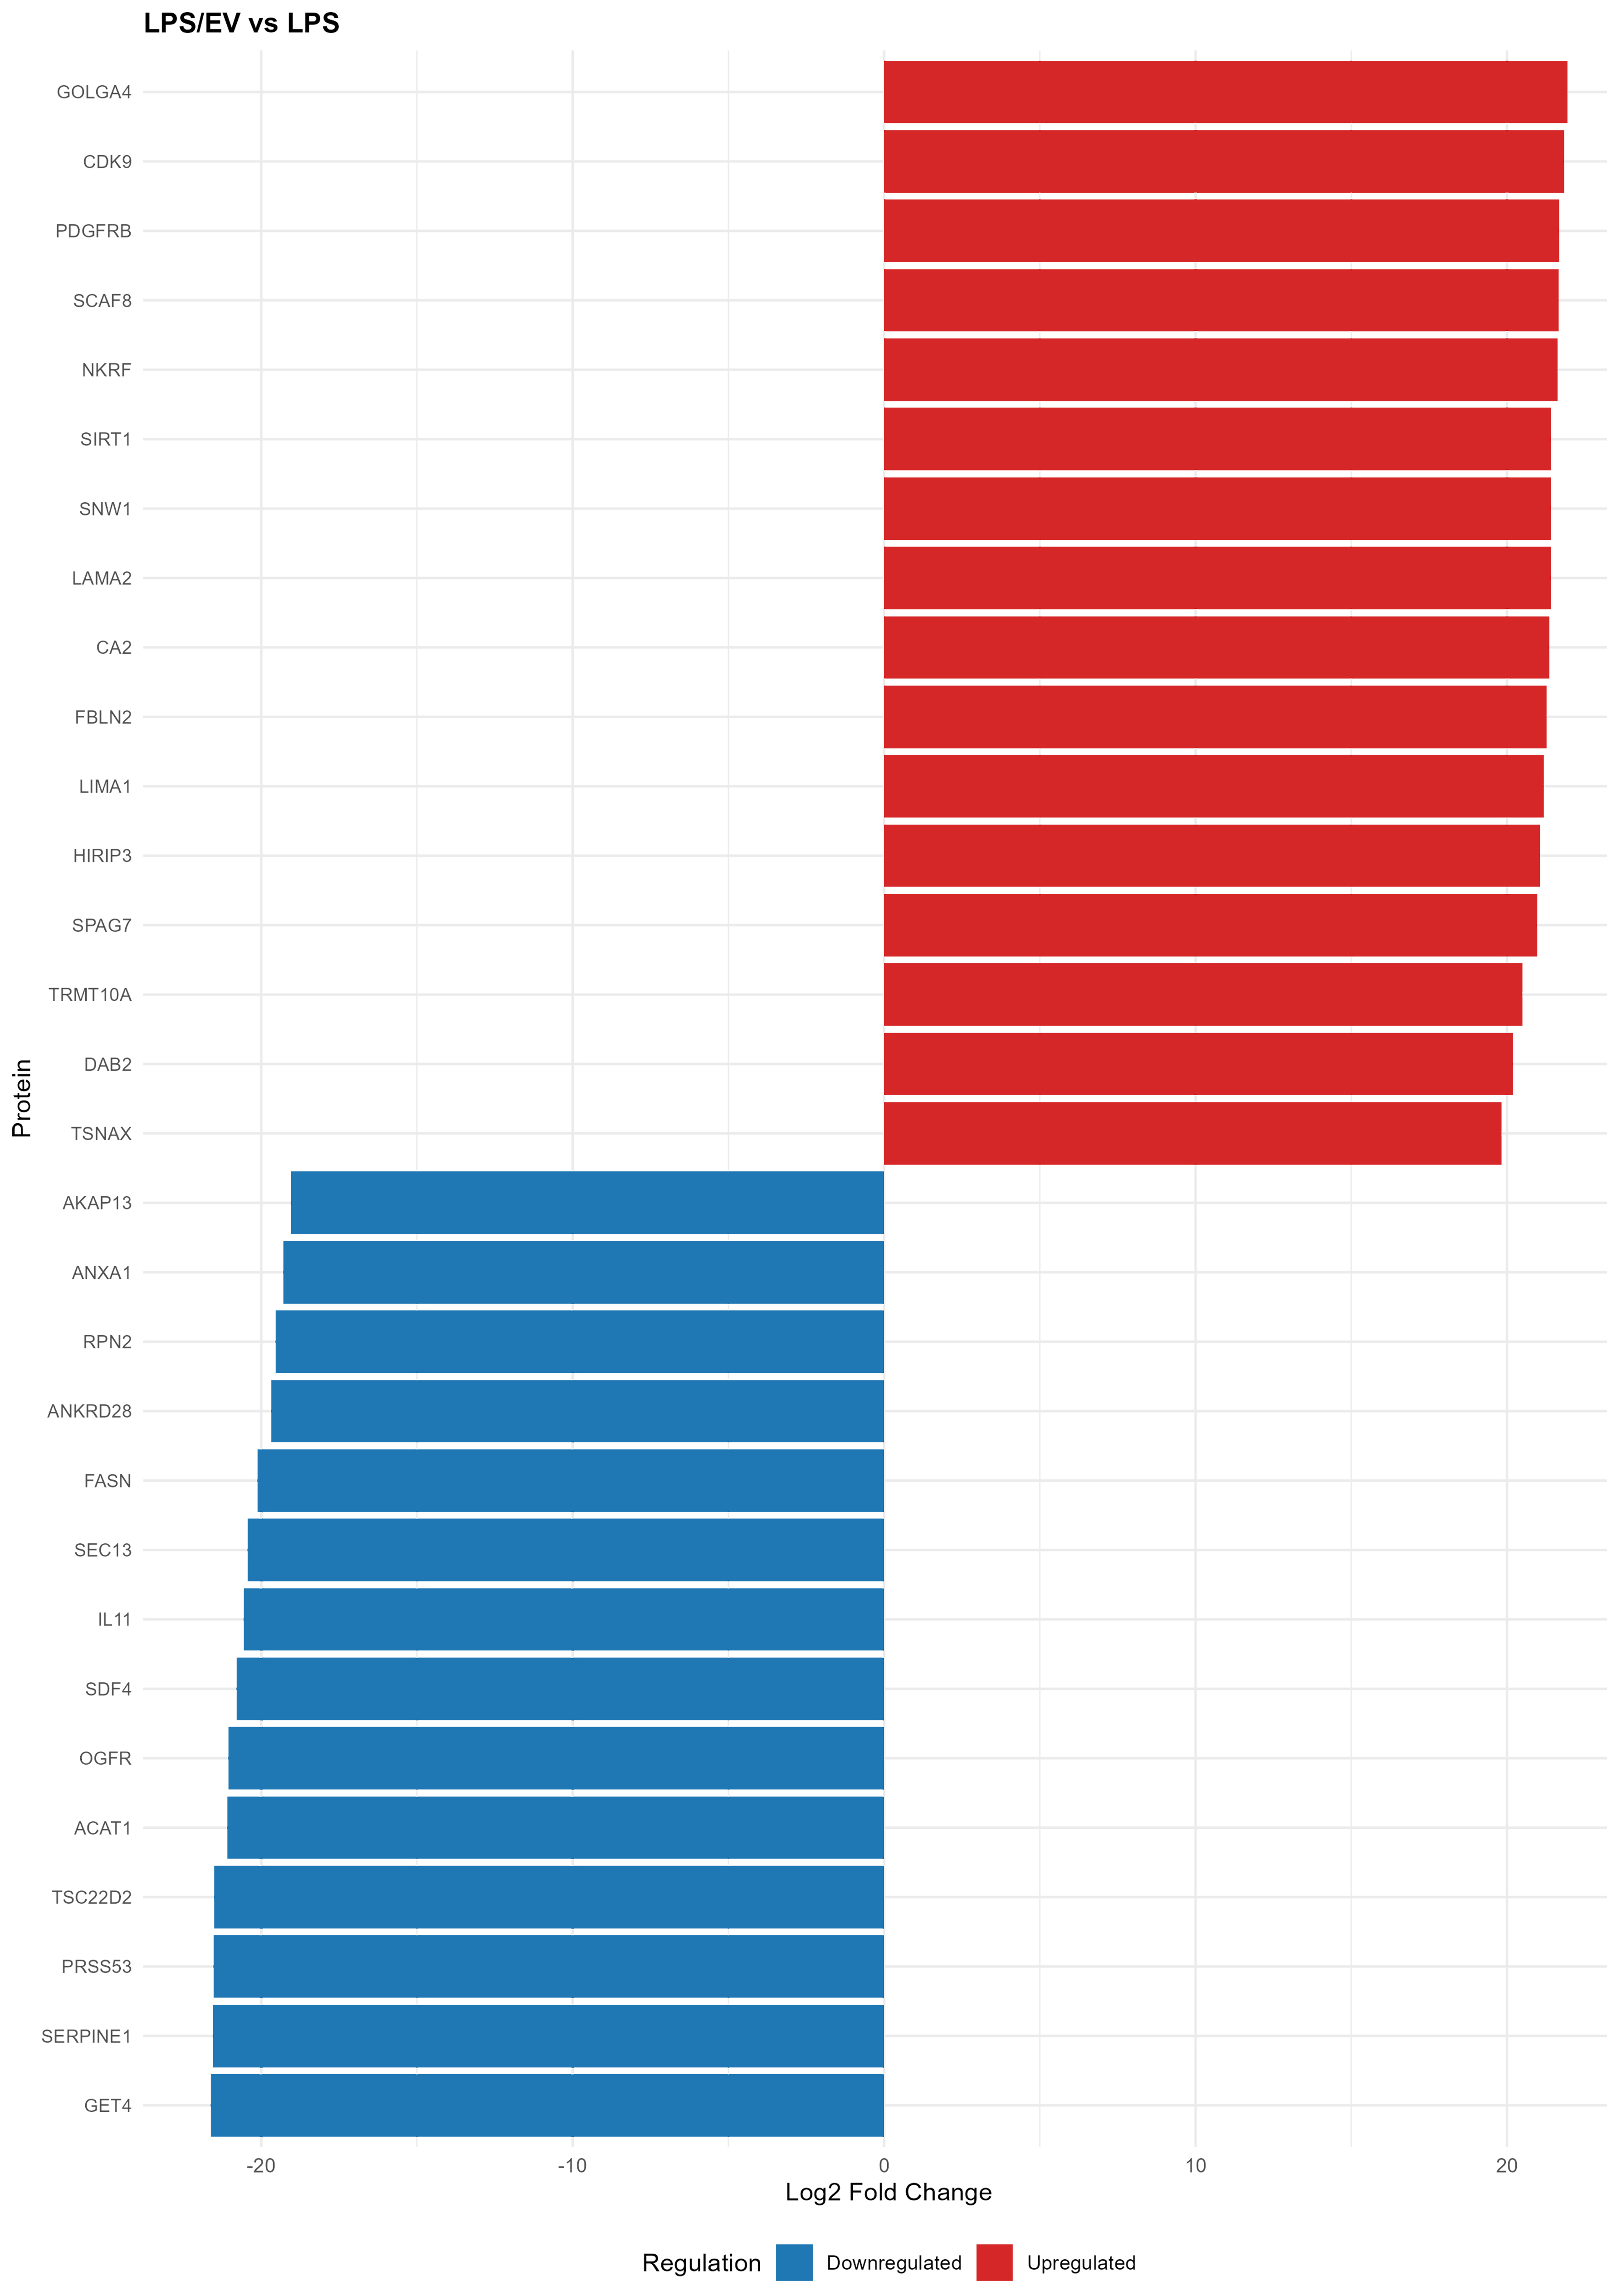
Figure 9. Bar chart showing the top 30 differentially modulated proteins by EV treatment, from the LPS/EV vs. LPS comparison. Red bars indicate upregulated proteins, and blue bars indicate downregulated proteins. The x-axis shows log2 fold change values. EV: Extracellular vesicles; LPS: lipopolysaccharide; LPS/EV: lipopolysaccharide plus extracellular vesicles combined treatment group; log2FC: log2 fold change.


