


fig6
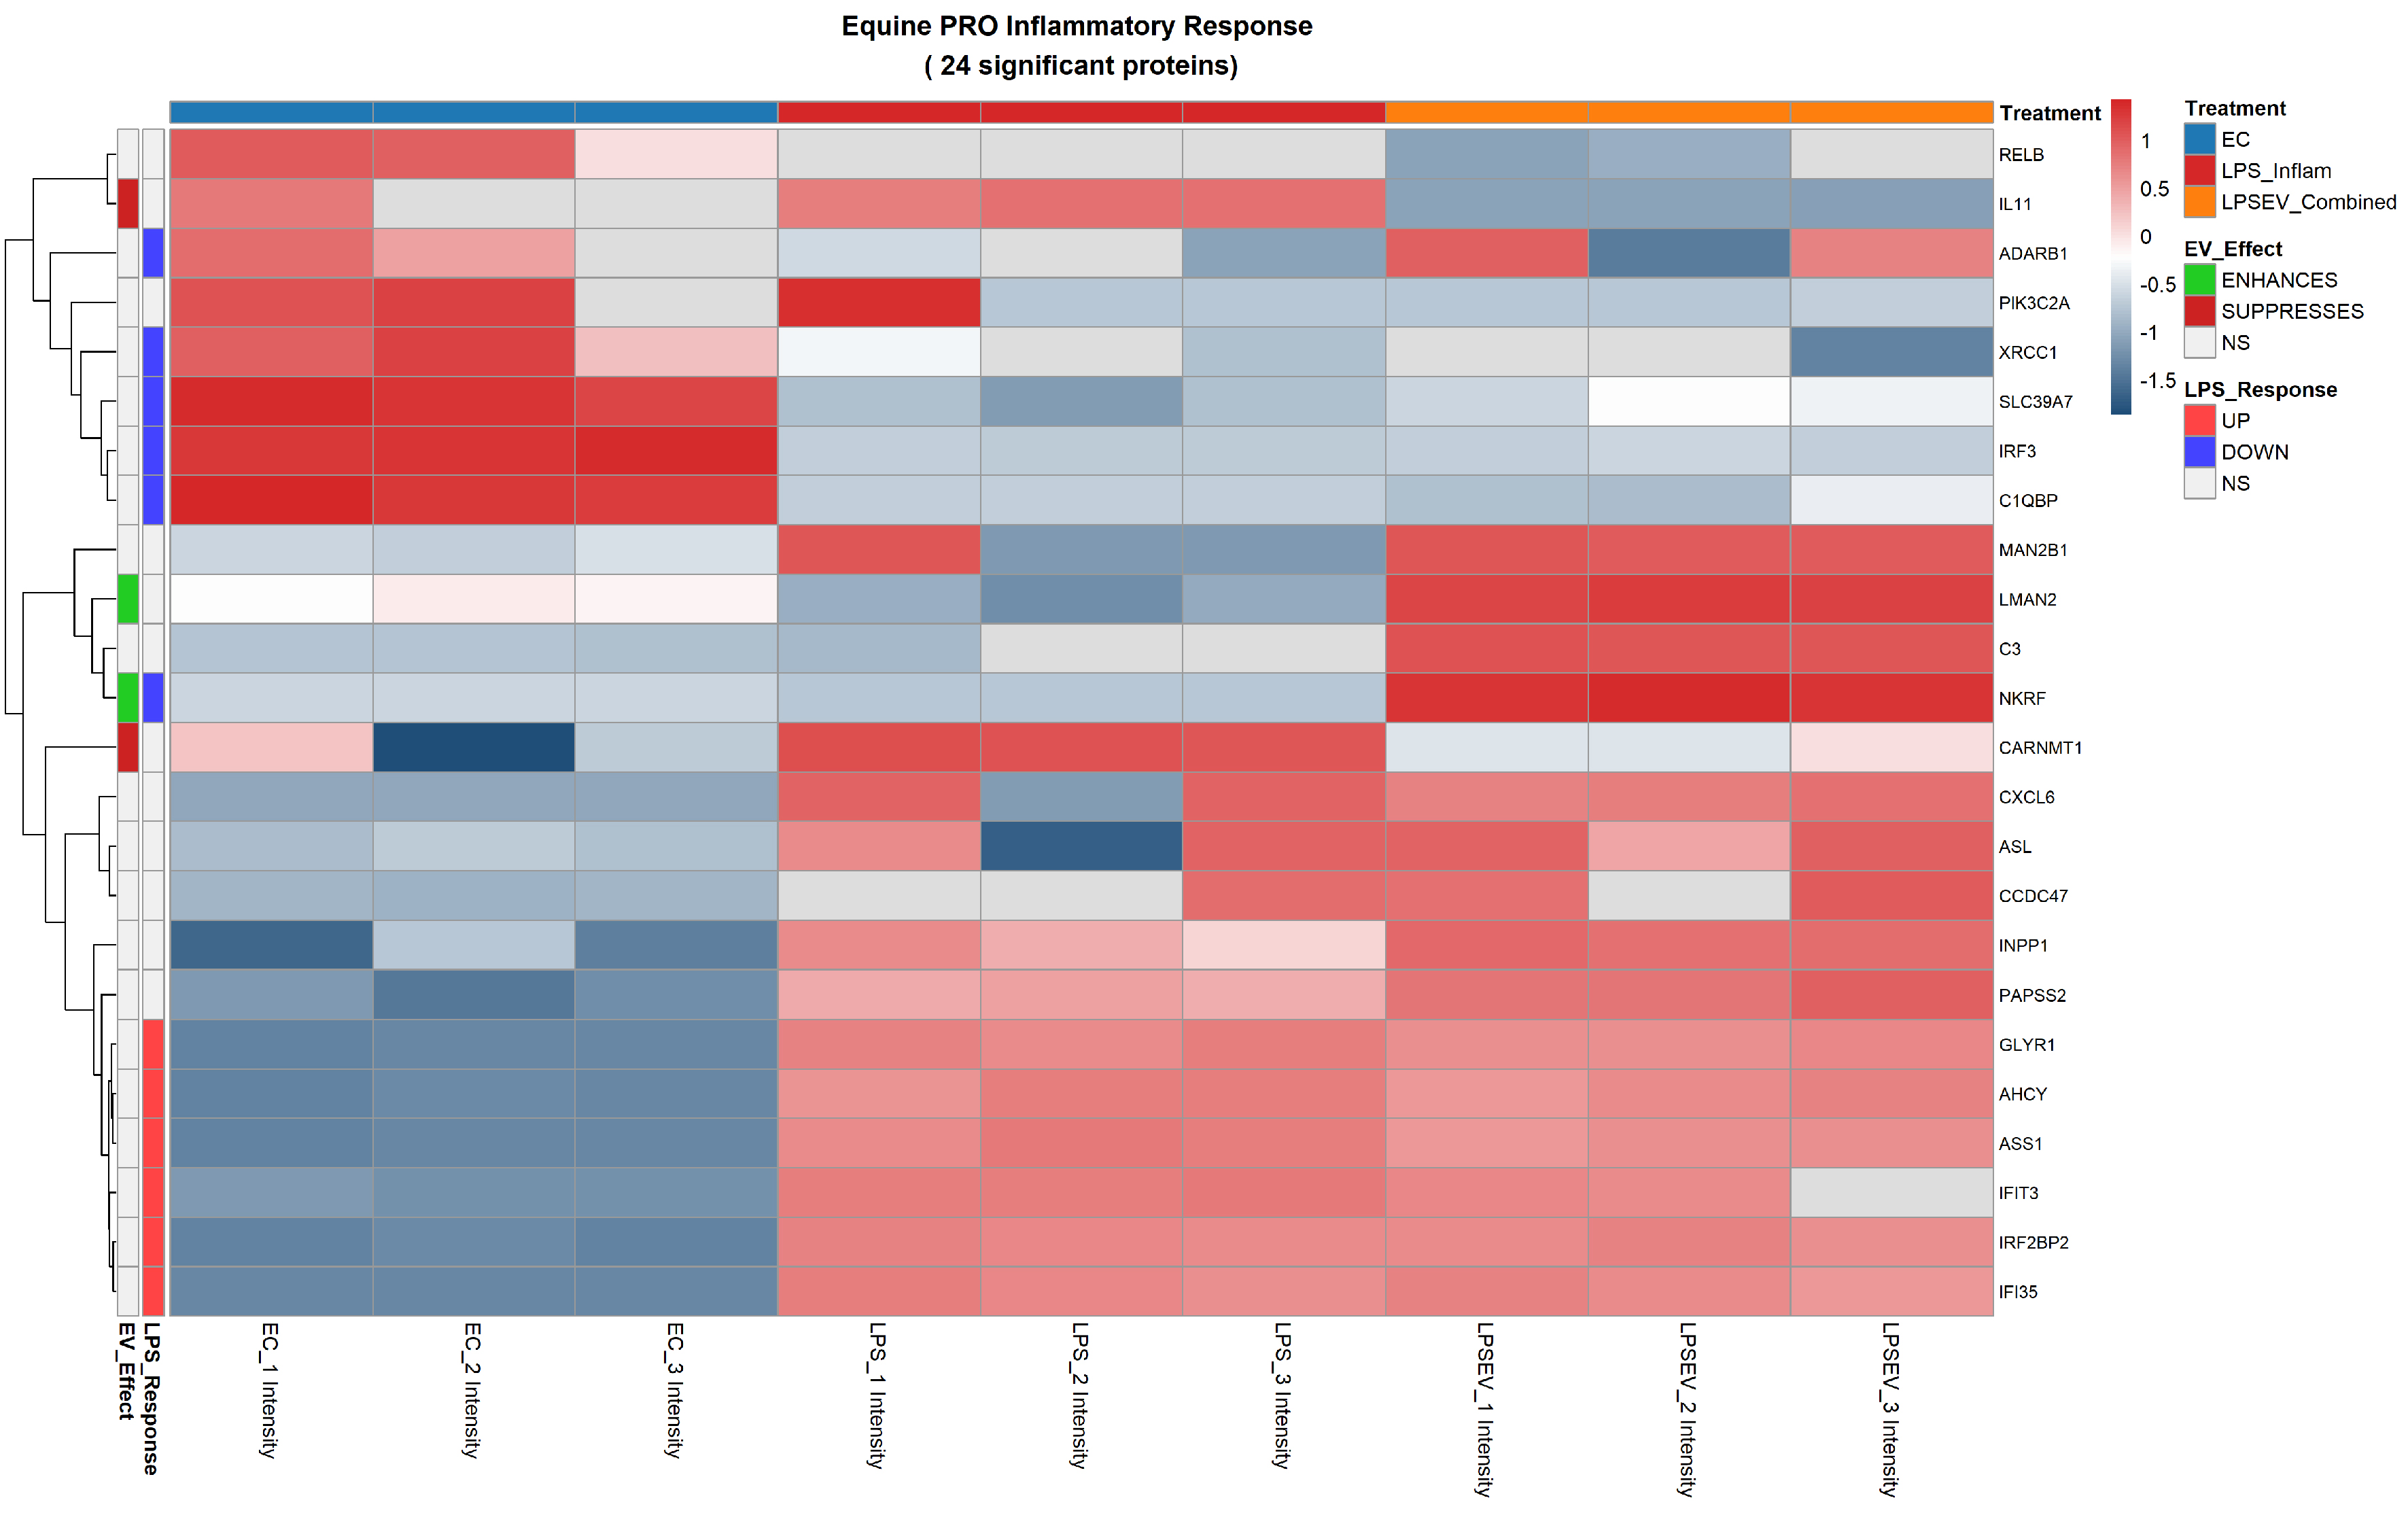
Figure 6. Pro-inflammatory response heatmap of 24 significant proteins differentially expressed among ECs, LPS and LPS/EV groups. Z-score normalized expression values are shown (red: higher, blue: lower). Left annotation columns: EV_Effect (green: enhanced by EVs, red: suppressed by EVs, white: not significant in LPS/EV vs. LPS comparison); LPS_Response (red: upregulated by LPS, blue: downregulated by LPS, white: not significant in LPS vs. ECs comparison). Upper colored bars indicate experimental groups: light blue (ECs), red (LPS), orange (LPS/EV). ECs: Endometrial cells; LPS: lipopolysaccharide; EVs: extracellular vesicles; NS: not significant; Z-score: standard score; LPS/EV: lipopolysaccharide plus extracellular vesicles combined treatment group.


