


fig5
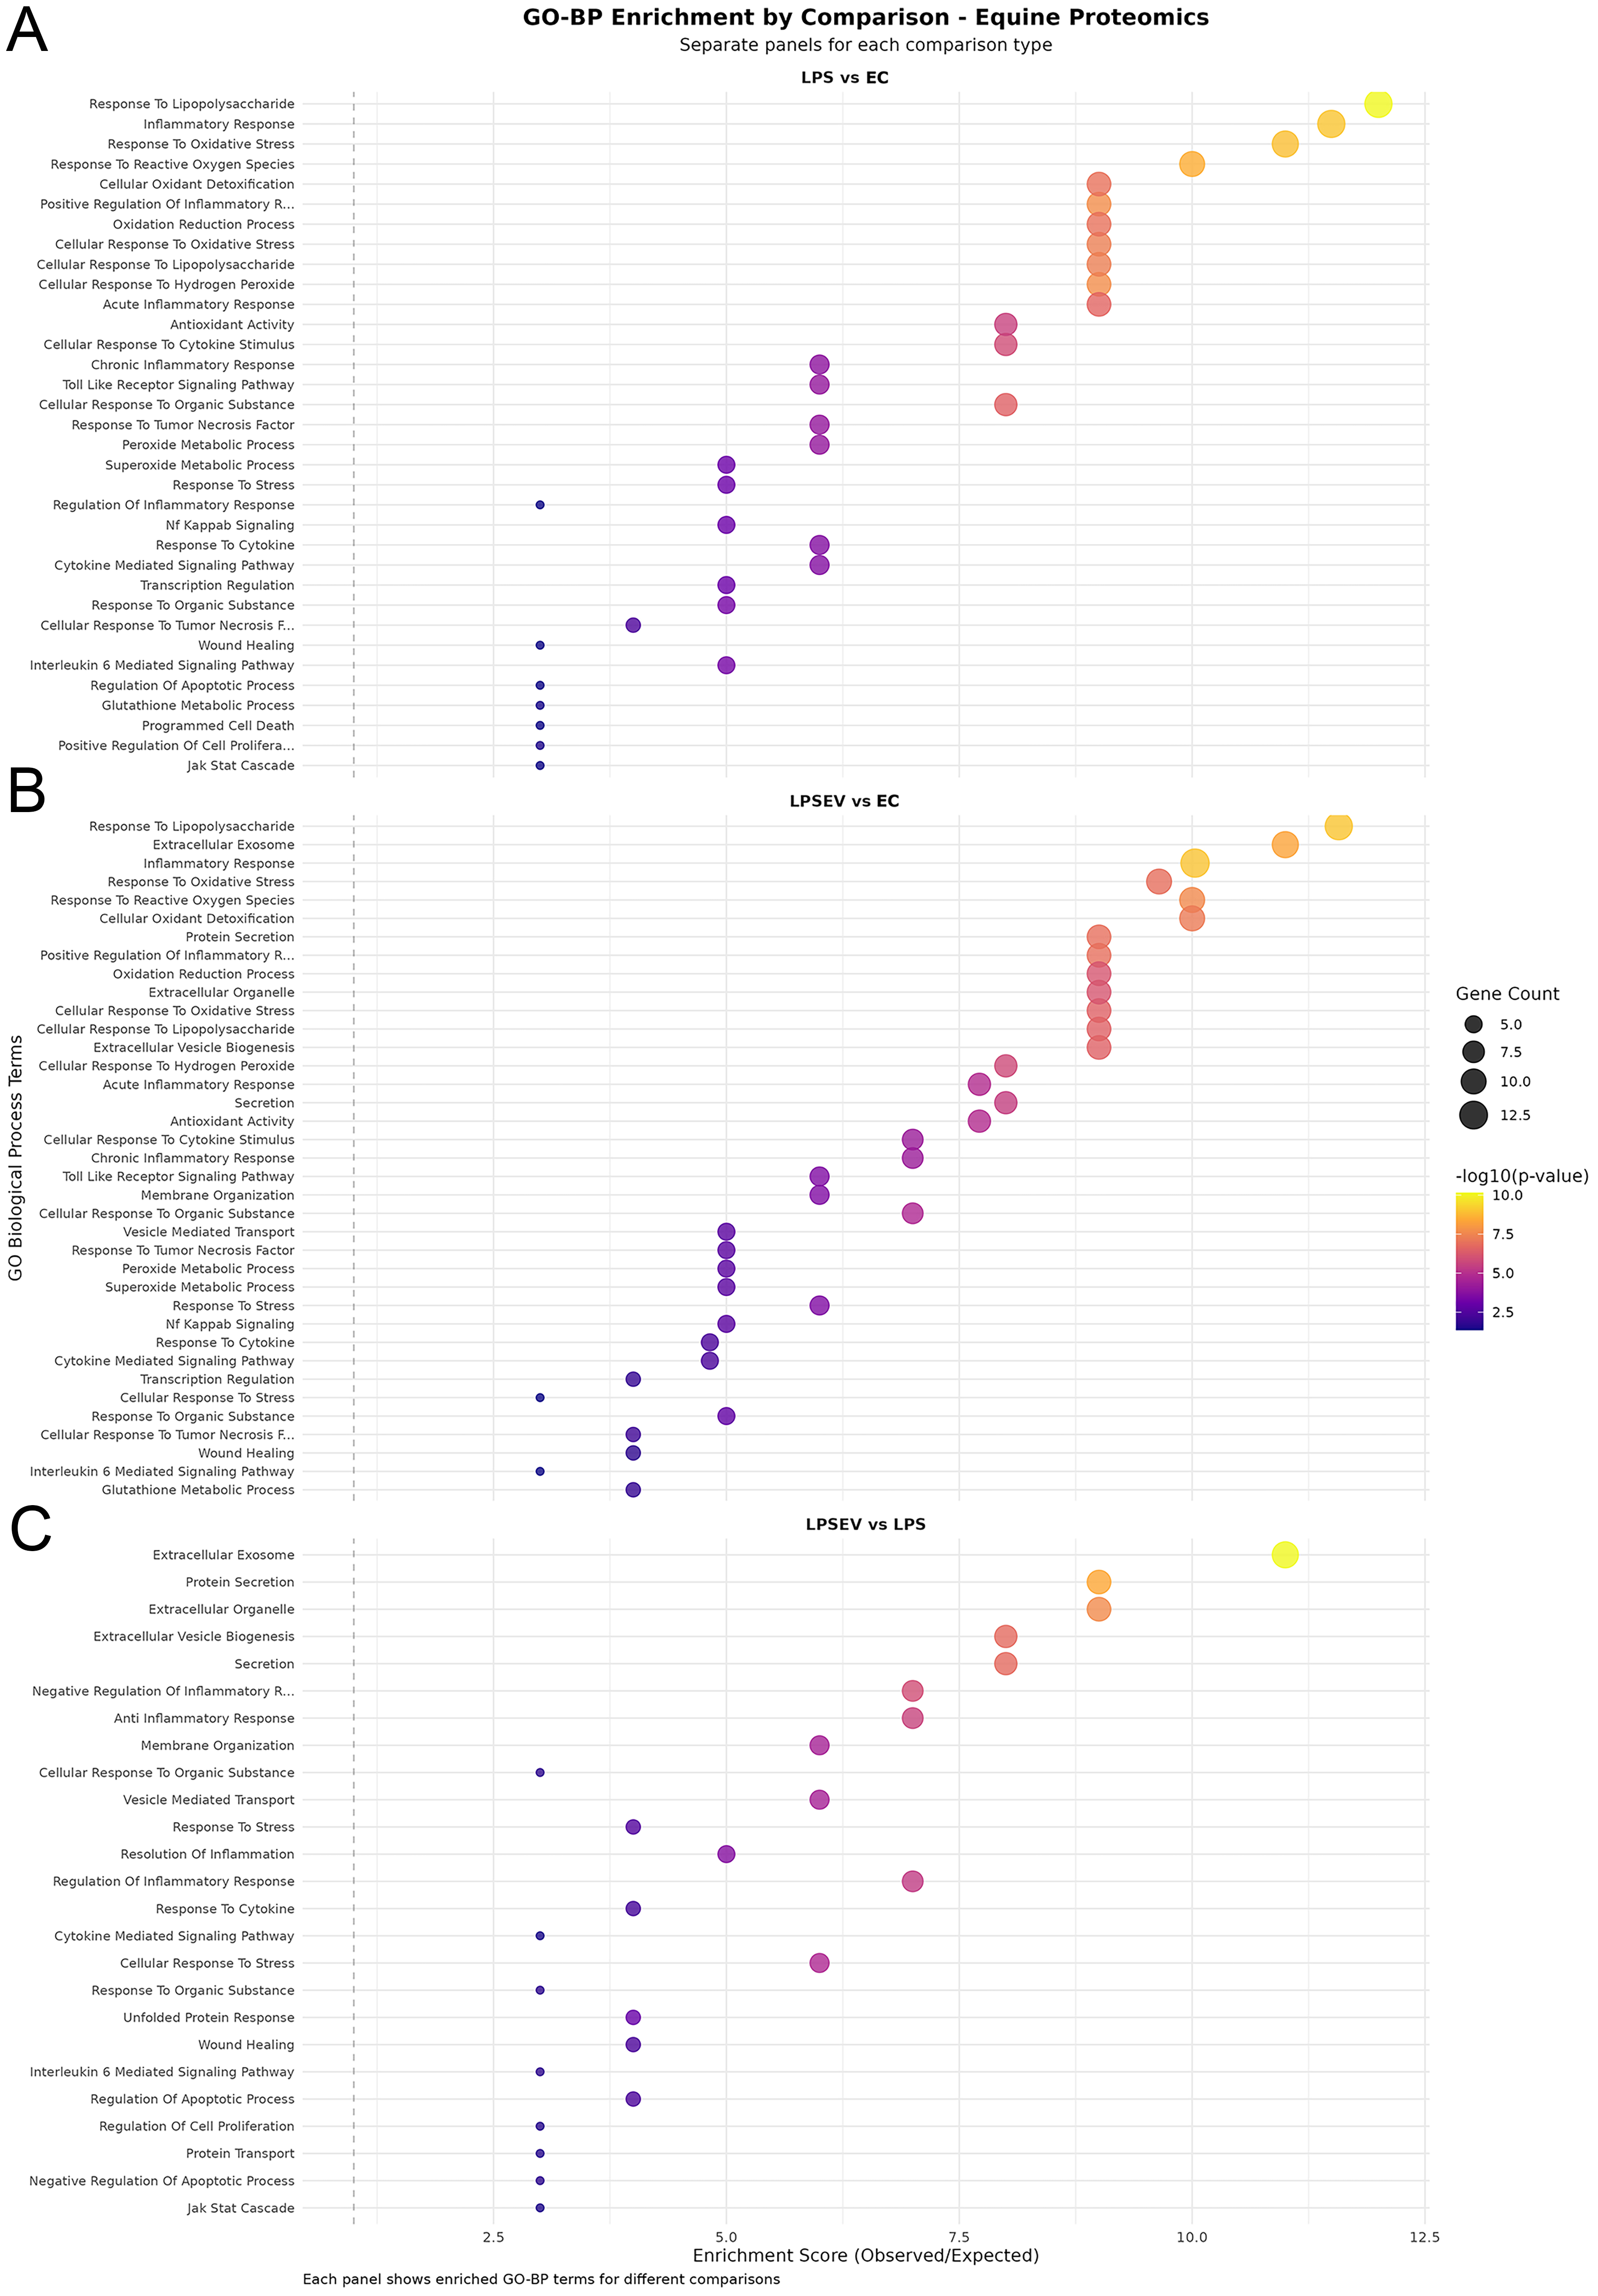
Figure 5. GO-BP enrichment dot plots. (A) Top enriched terms in the LPS vs. ECs comparison; (B) Top enriched terms in the LPS/EV vs. ECs comparison; (C) Top enriched terms in the LPS/EV vs. LPS comparison. Dot size represents gene count; color scale indicates the enrichment P value. GO-BP: Gene Ontology Biological Process; ECs: endometrial cells; LPS: lipopolysaccharide; EV: extracellular vesicle; LPS/EV: lipopolysaccharide plus extracellular vesicles combined treatment group.


