


fig4
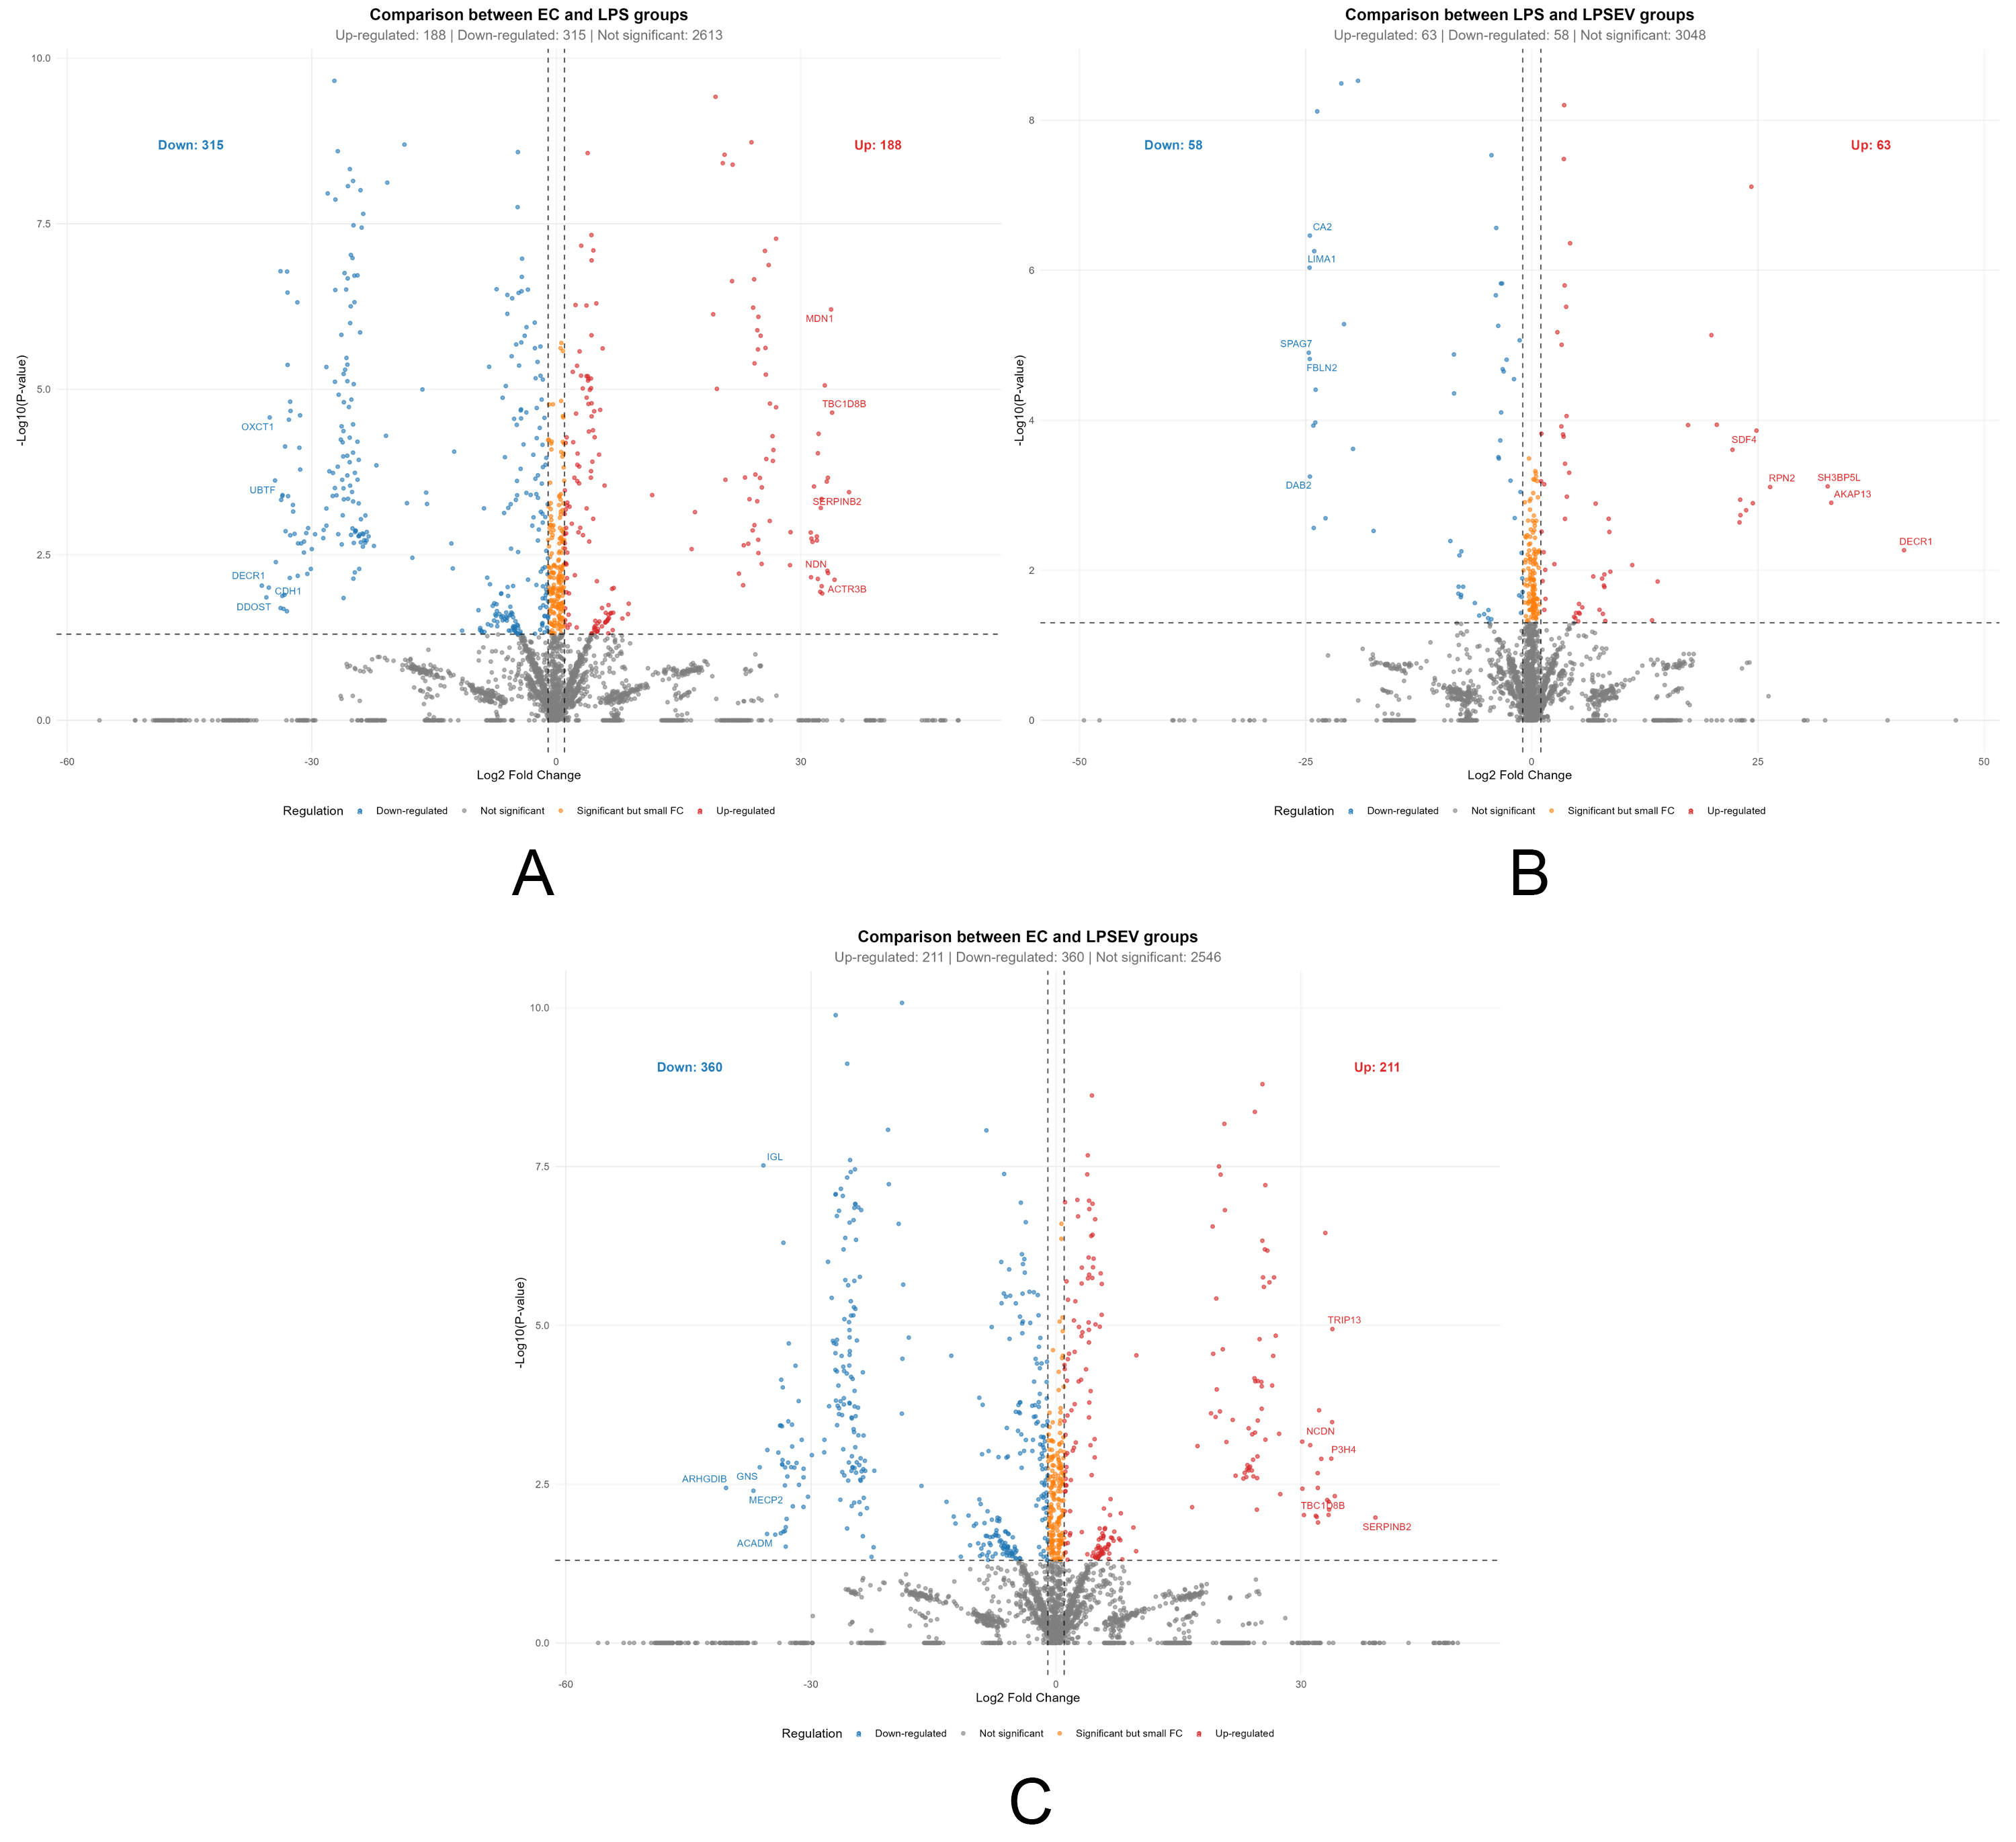
Figure 4. Differentially expressed proteins among groups represented by volcano plots (P < 0.05, |log2 fold change| ≥ 1). (A) Comparison between ECs and LPS groups (Up-regulated: 188; Down-regulated: 315); (B) Comparison between LPS and LPS/EV groups (Up-regulated: 63; Down-regulated: 58); (C) Comparison between ECs and LPS/EV groups (Up-regulated: 211; Down-regulated: 360). The x-axis shows log2 fold change, while the y-axis shows -log10 P values. Dashed lines indicate significance thresholds. ECs: Endometrial cells; LPS: lipopolysaccharide; EV: extracellular vesicle; LPS/EV: lipopolysaccharide plus extracellular vesicles combined treatment group.


