


fig3
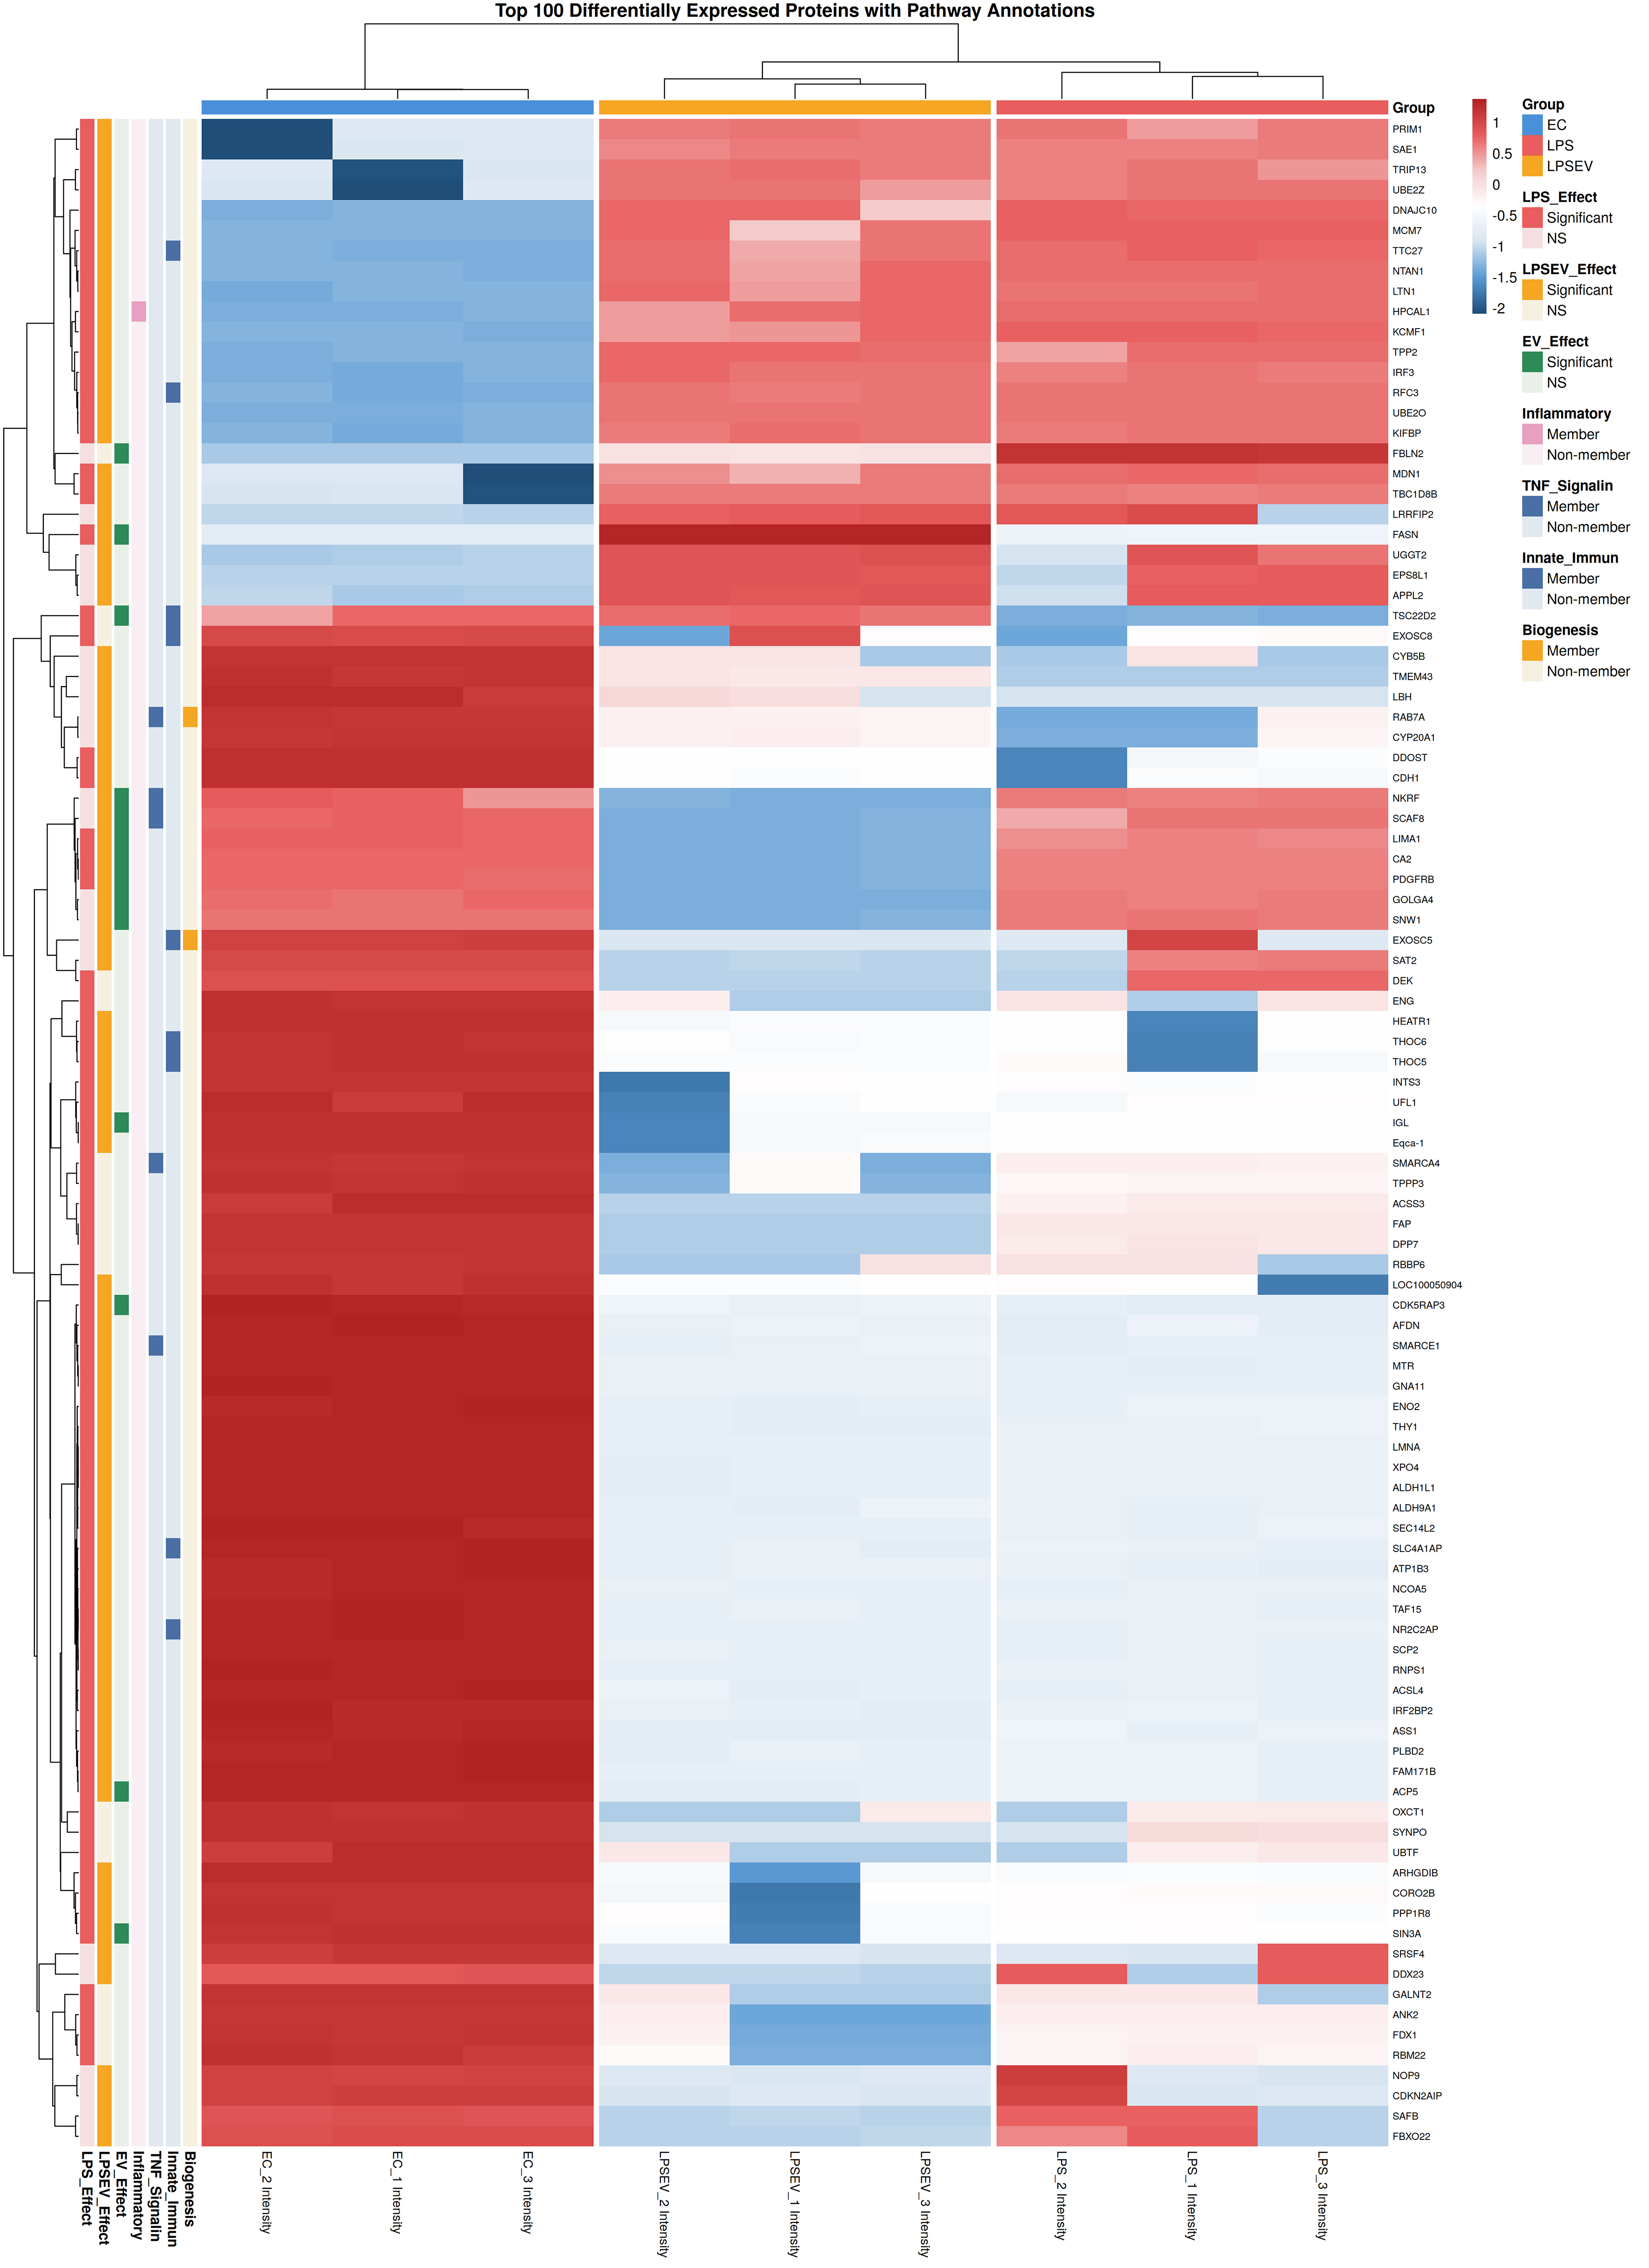
Figure 3. Heatmap visualization of the top 100 differentially expressed proteins among ECs, LPS and LPS/EV groups. Z-score normalized expression values are displayed, with red indicating higher relative expression and blue lower relative expression. Hierarchical clustering was performed on both proteins (rows) and samples (columns). Annotation bars indicate membership in key biological pathways (EV biogenesis, innate immunity, TNF signaling, inflammatory response) and statistical significance of each protein in the three pairwise comparisons. ECs: Endometrial cells; LPS: lipopolysaccharide; EV: extracellular vesicle; TNF: tumor necrosis factor; LPS/EV: lipopolysaccharide plus extracellular vesicles combined treatment group.


