


fig2
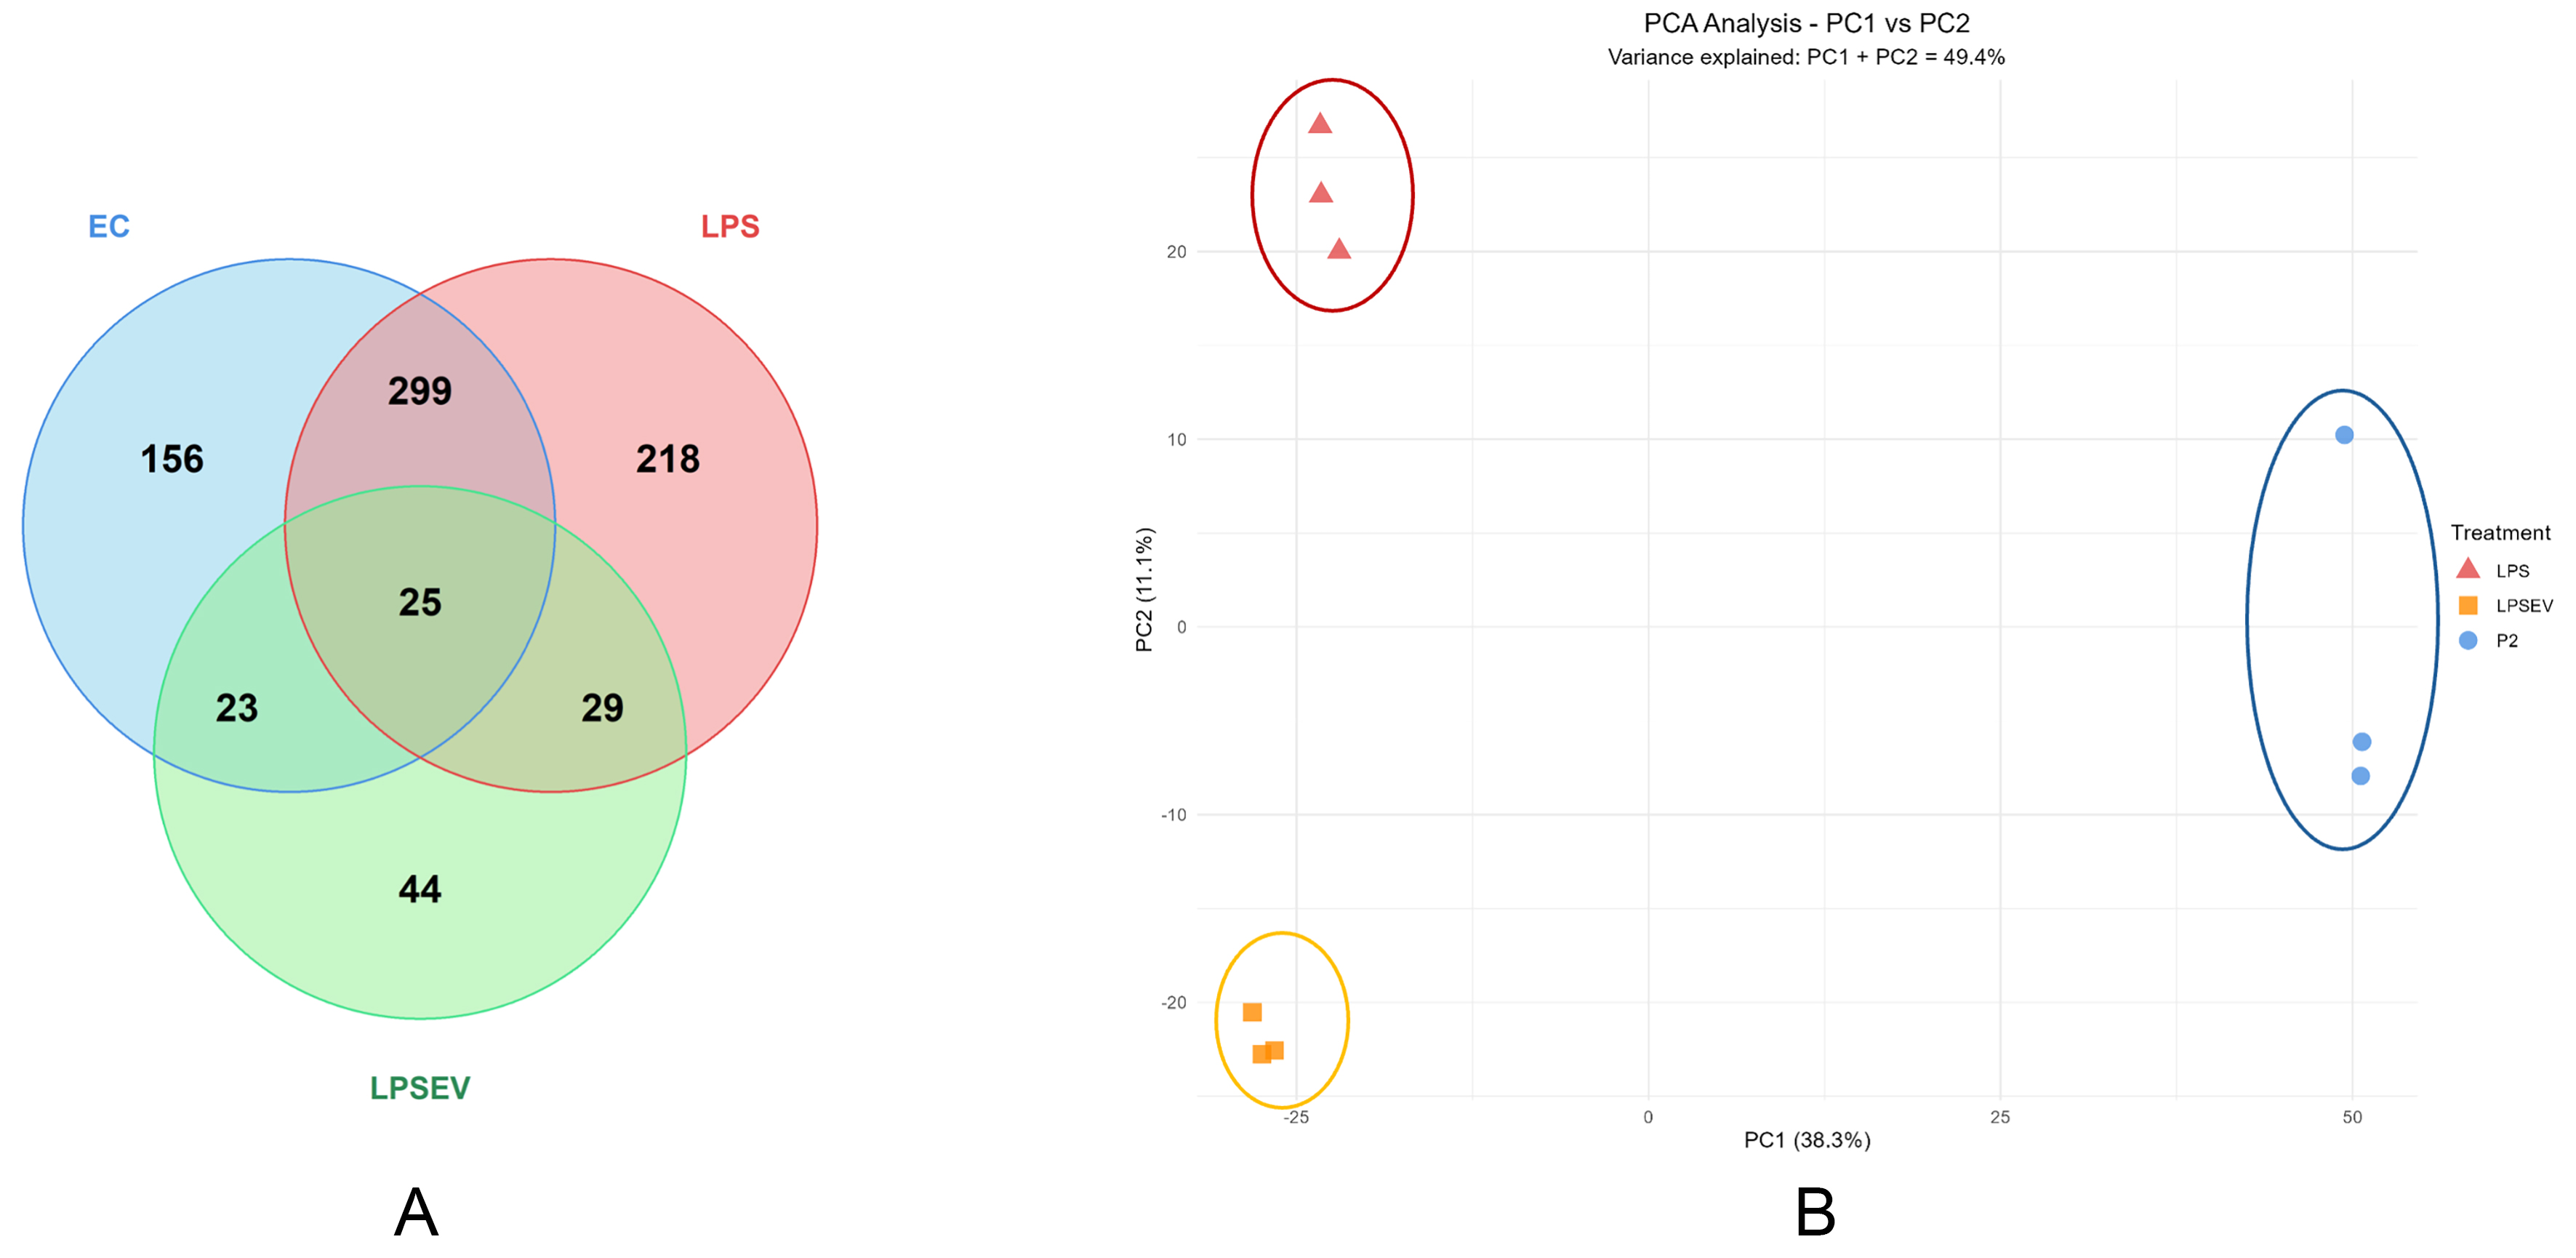
Figure 2. Protein expression characterization of ECs, LPS and LPS/EV groups. (A) Venn diagram illustrating the distribution of significantly regulated proteins (P < 0.05, |log2 fold change| > 1) across the three pairwise comparisons: LPS vs. ECs (503 proteins), LPS/EV vs. ECs (571 proteins), and LPS/EV vs. LPS (121 proteins). Numbers indicate proteins unique to each comparison or shared between comparisons; (B) PCA showing different clustering of the three groups. PC1 (46.1% variance) and PC2 (13% variance) separate control ECs (blue ellipse), LPS (red ellipse) and LPS/EV (orange ellipse) groups, indicating substantial proteomic differences among groups. PCA: Principal component analysis; PC1: principal component 1; PC2: principal component 2; ECs: endometrial cells; LPS: lipopolysaccharide; EV: extracellular vesicle; LPS/EV: lipopolysaccharide plus extracellular vesicles combined treatment group.


