


fig5
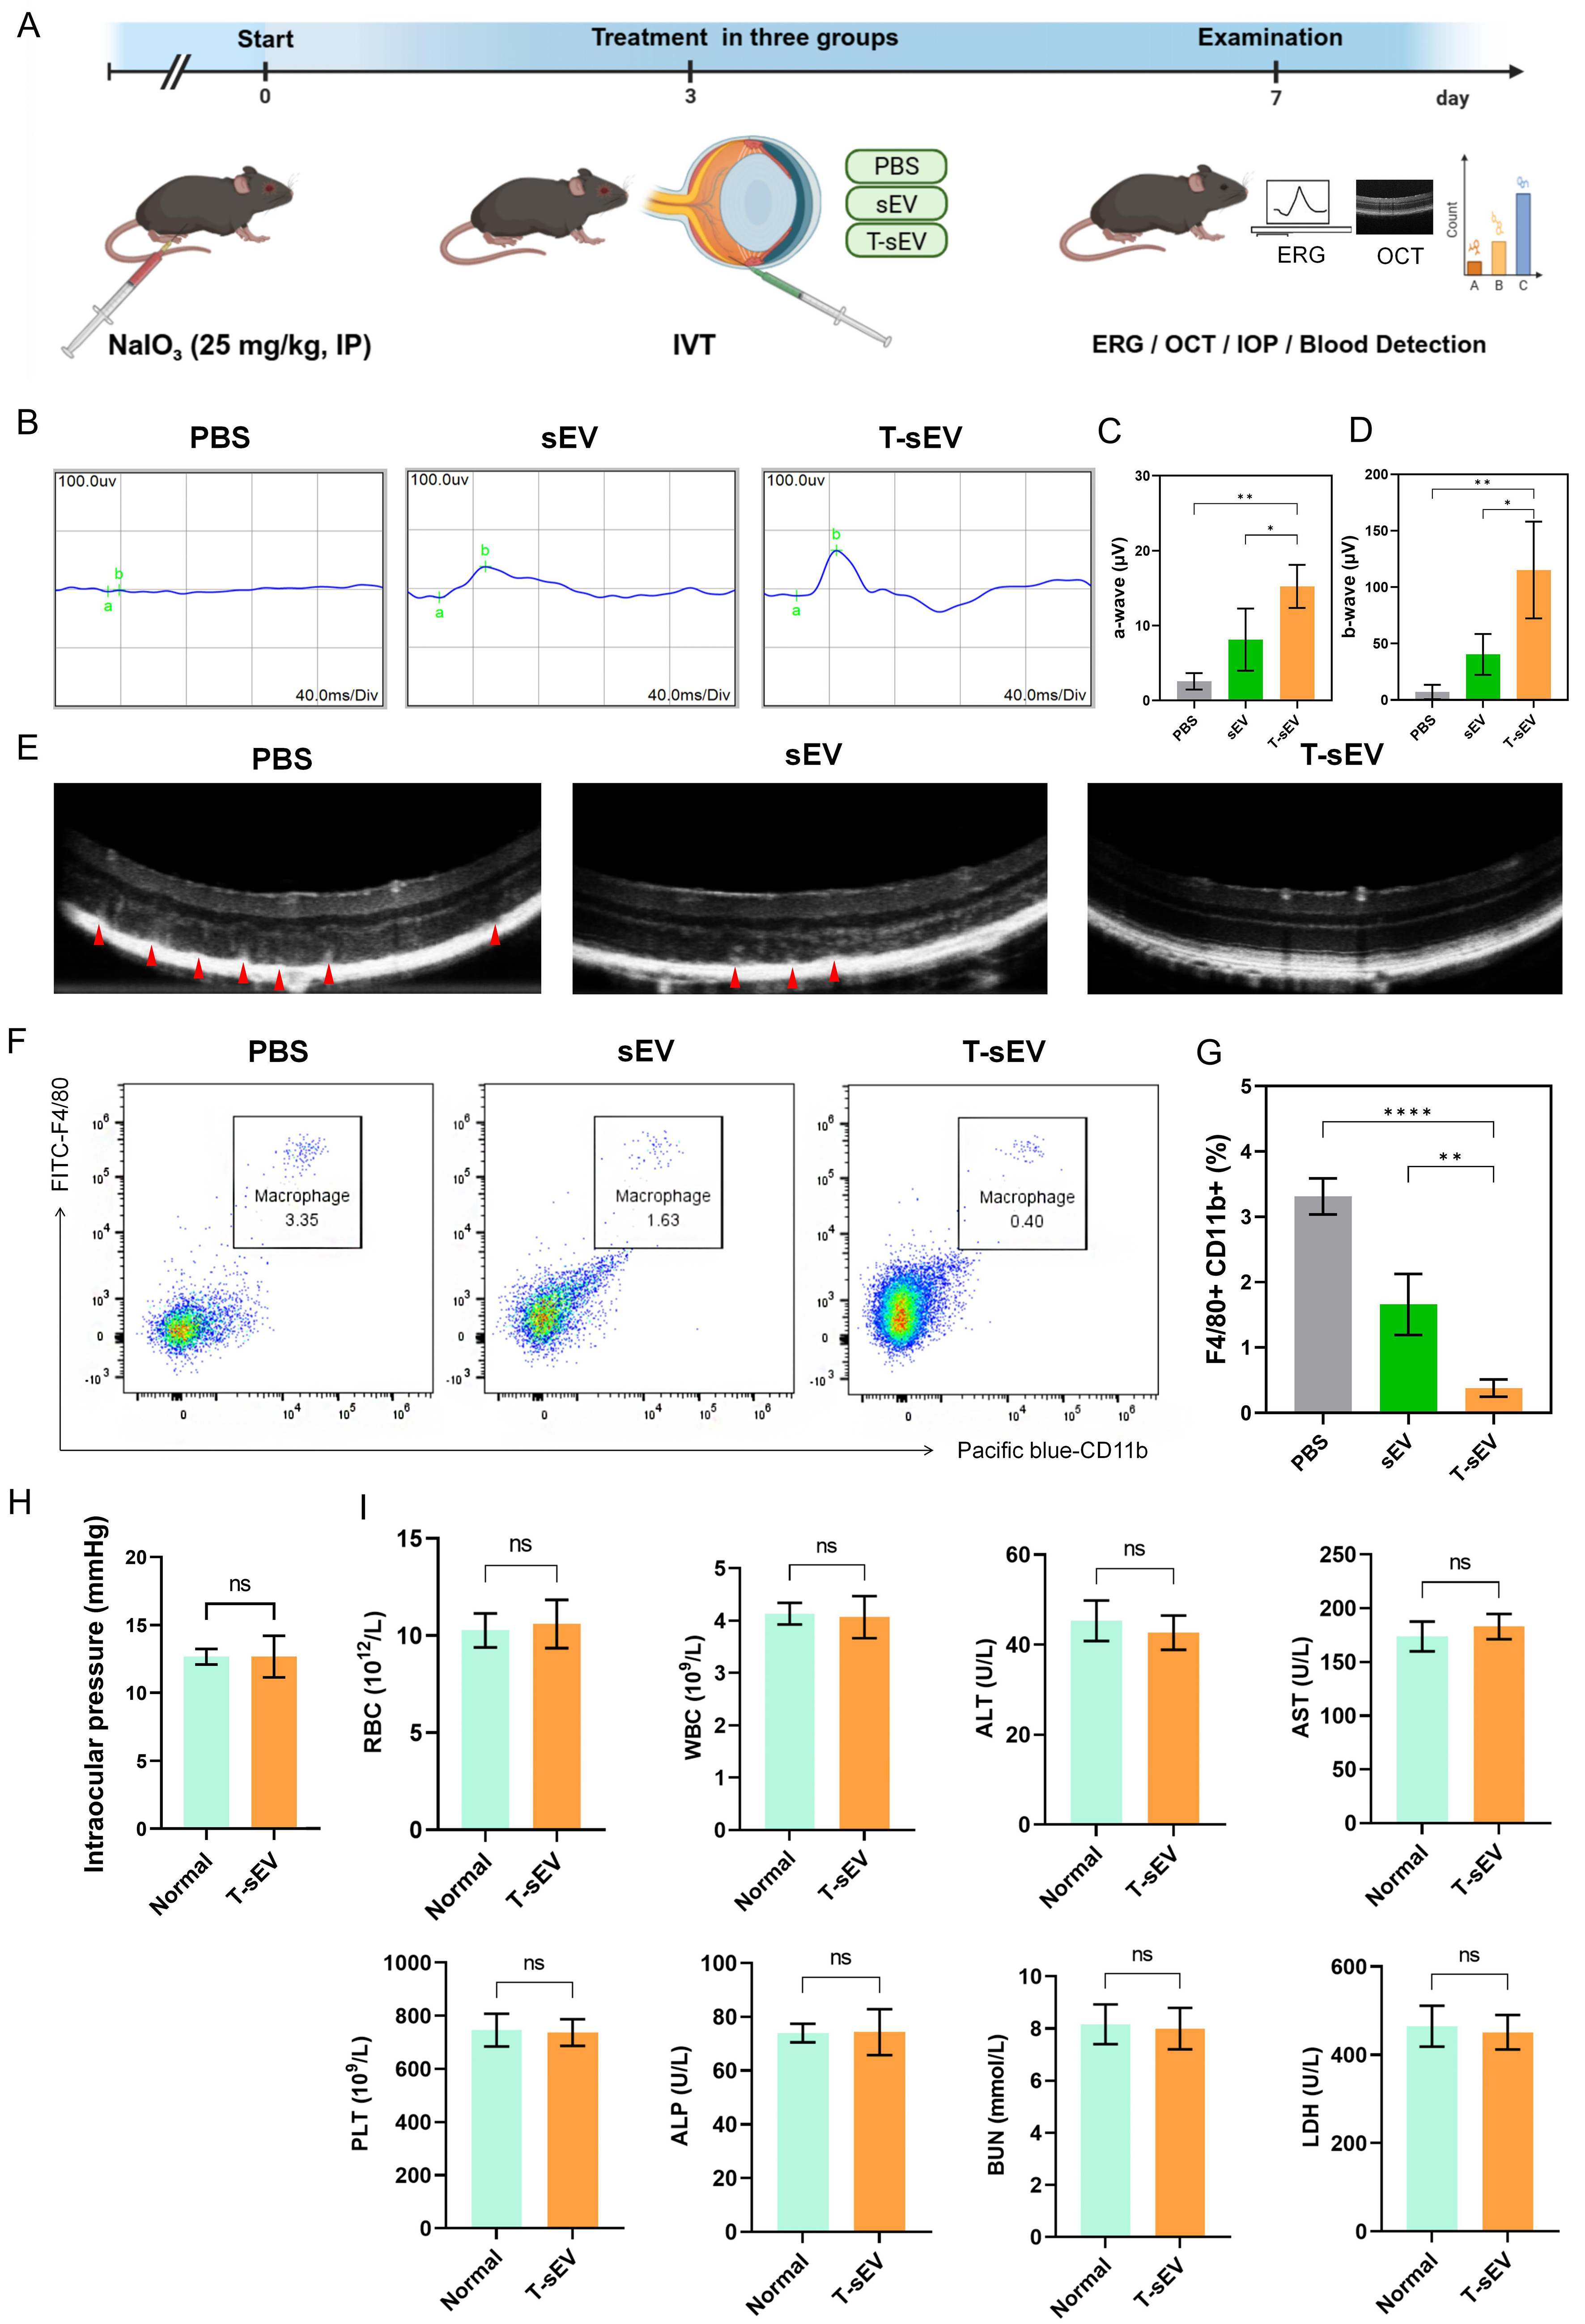
Figure 5. Functional, structural, and systemic safety assessment of T-sEV therapy in a NaIO3-induced murine model of retinal degeneration. (A) Experimental timeline outlining key procedures: induction of retinal degeneration, IVT injection of PBS, sEV, or T-sEV on day 3, and final analysis on day 7; (B) Representative electroretinogram waveforms under different treatment conditions; (C and D) Quantitative analysis of a-wave (C) and b-wave (D) amplitudes (n = 3, 1 eye from each of 3 mice); (E) Representative OCT images of retinal morphology across treatment groups. Red arrows indicate hyperreflective foci located within the outer retinal layers. Scale bar:


