


fig3
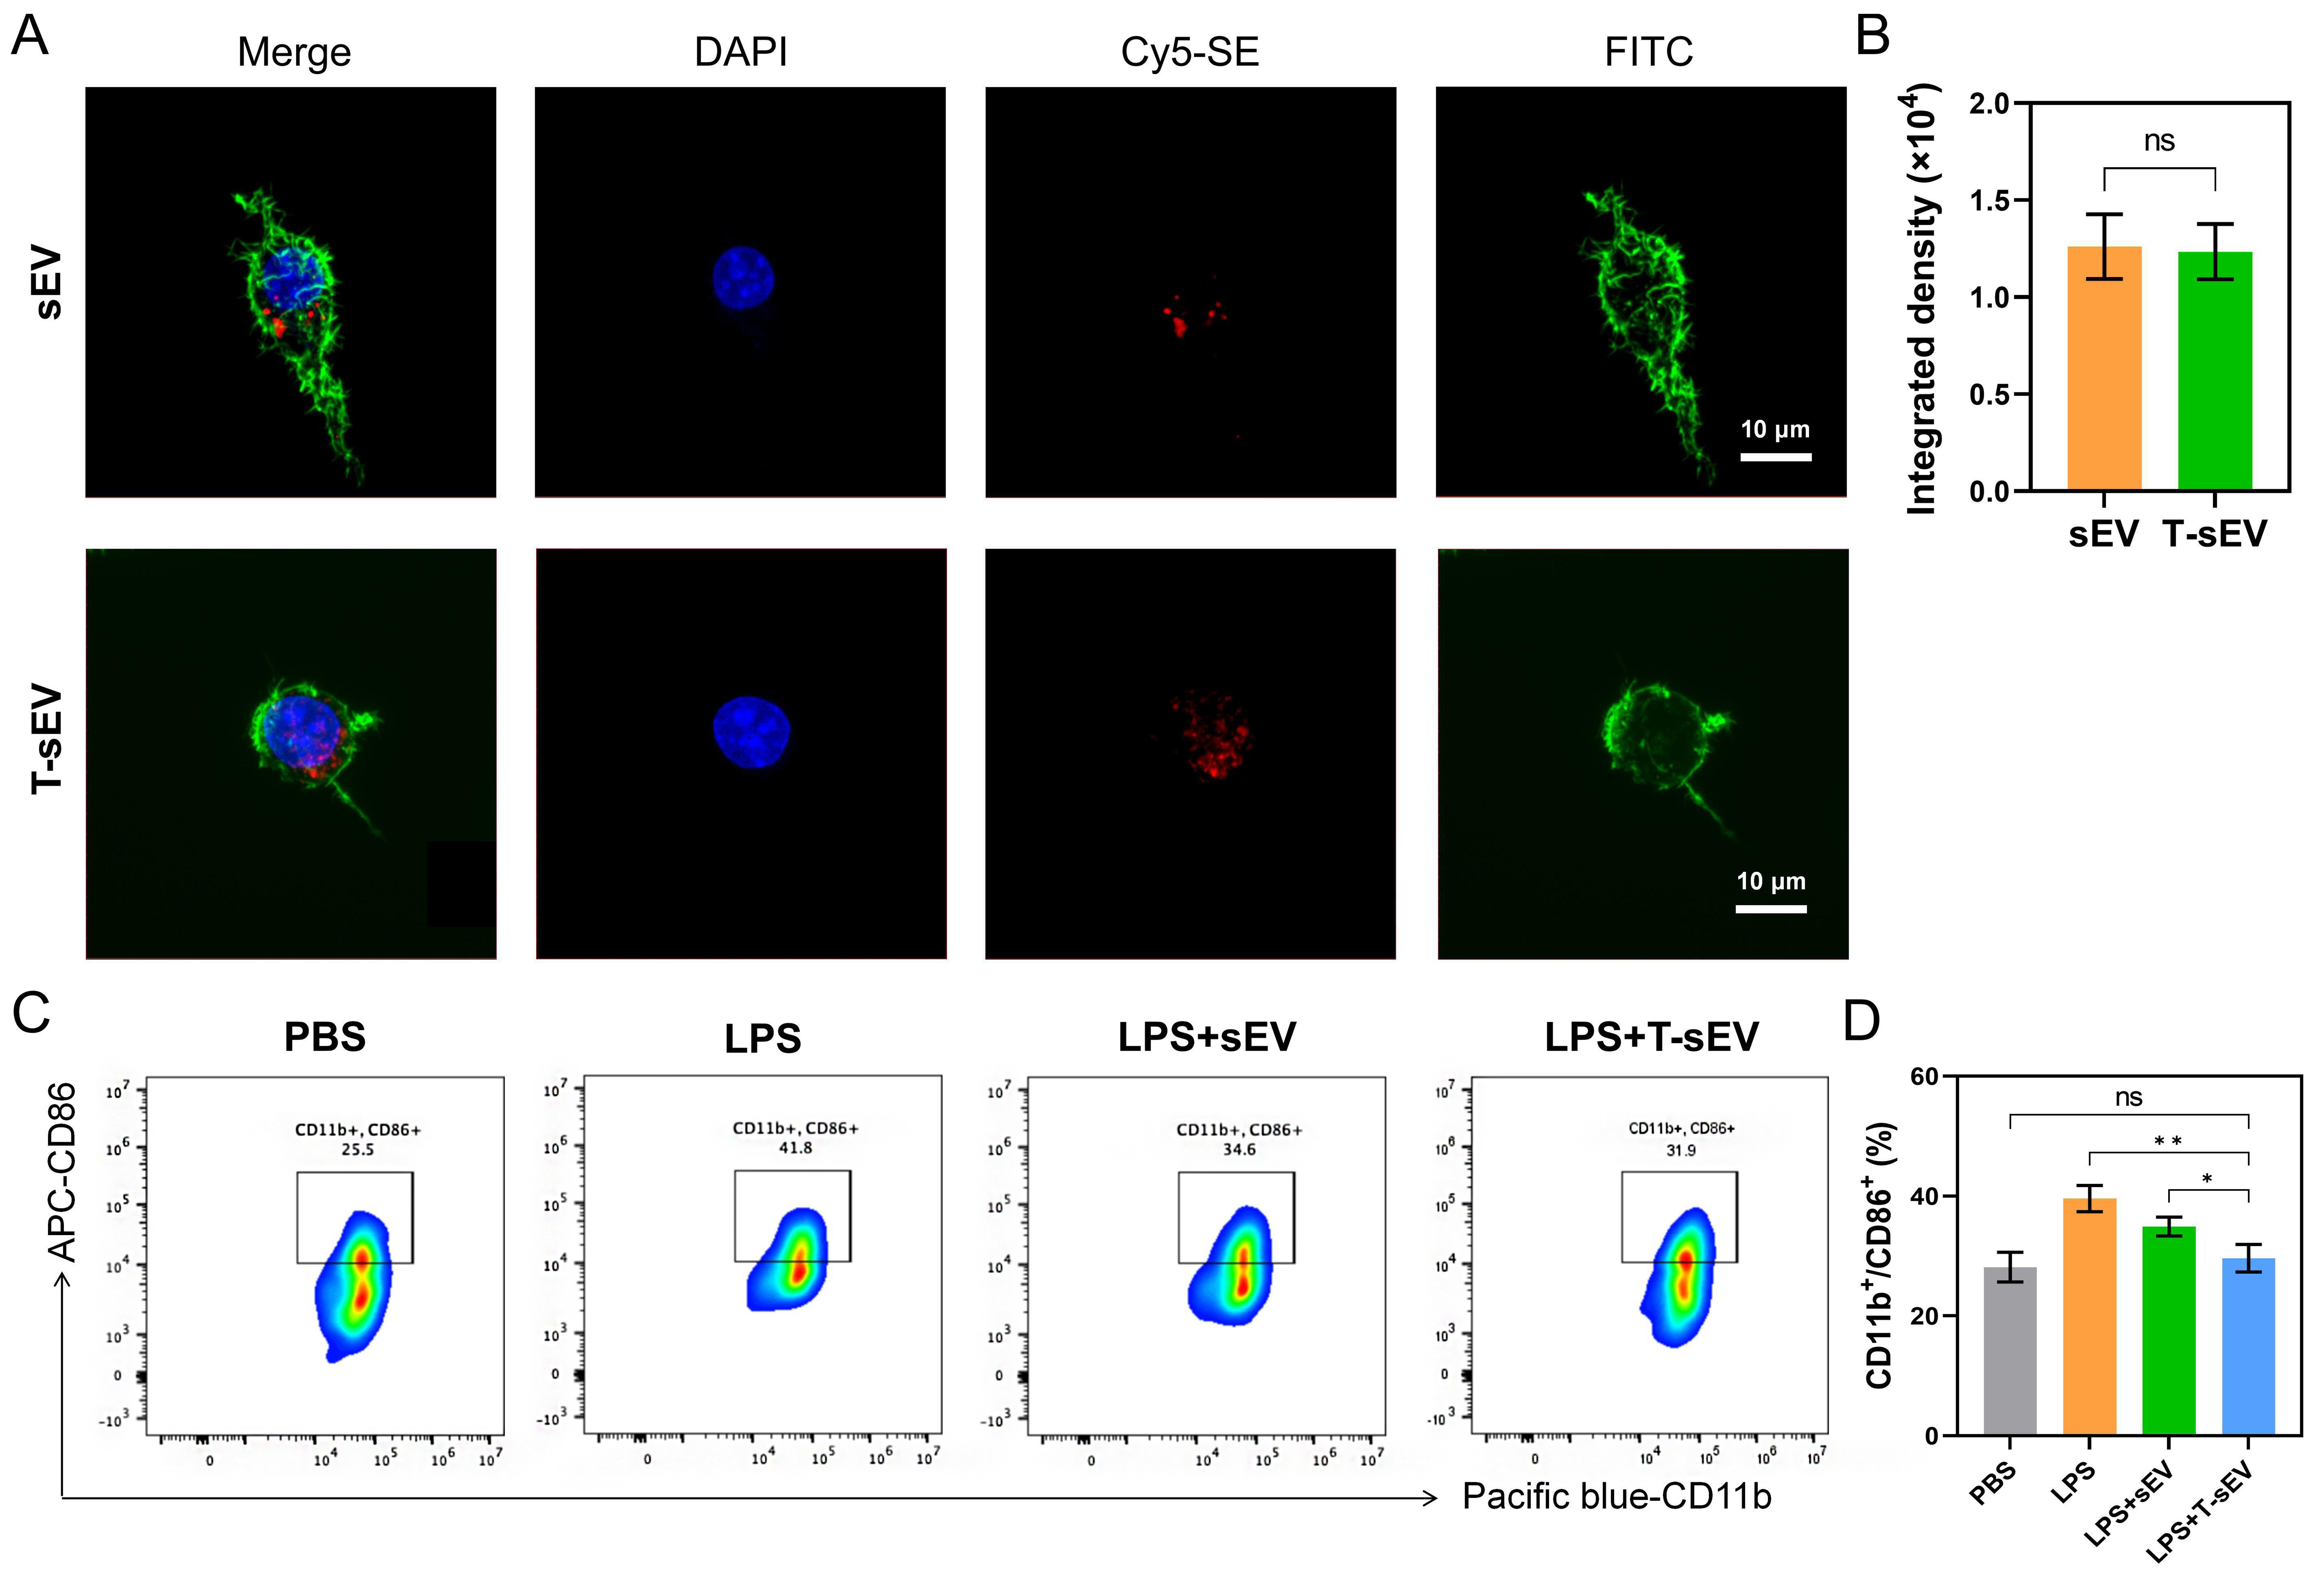
Figure 3. Uptake of T-sEV by macrophages and their effect on macrophage activation. (A) Confocal microscopy images of FITC-labeled cells (green) incubated with Cy5-SE-labeled T-sEV (red). Nuclei are stained with DAPI (blue). Scale bar: 10 μm; (B) Quantification of cellular uptake based on integrated fluorescence density (n = 3 biologically independent samples); (C) Representative flow cytometry plots of CD11b+/CD86+ cells under the indicated treatments (n = 3 biologically independent samples); (D) Quantification of CD11b+/CD86+ macrophages. Data in (B and D) are presented as mean ± SD, and are compared by two-tailed unpaired Student’s t-test (B) or one-way ANOVA (D). *P < 0.05; **P < 0.01. MSC: Mesenchymal stem cell; sEV: small extracellular vesicles; T-sEV: sEV derived from TNF-α-primed MSCs; DAPI: 4’,6-diamidino-2-phenylindole; Cy5-SE: cyanine 5 succinimidyl ester; FITC: fluorescein isothiocyanate; CD: cluster of differentiation; SD: standard deviation; ns: no significance.


