


fig1
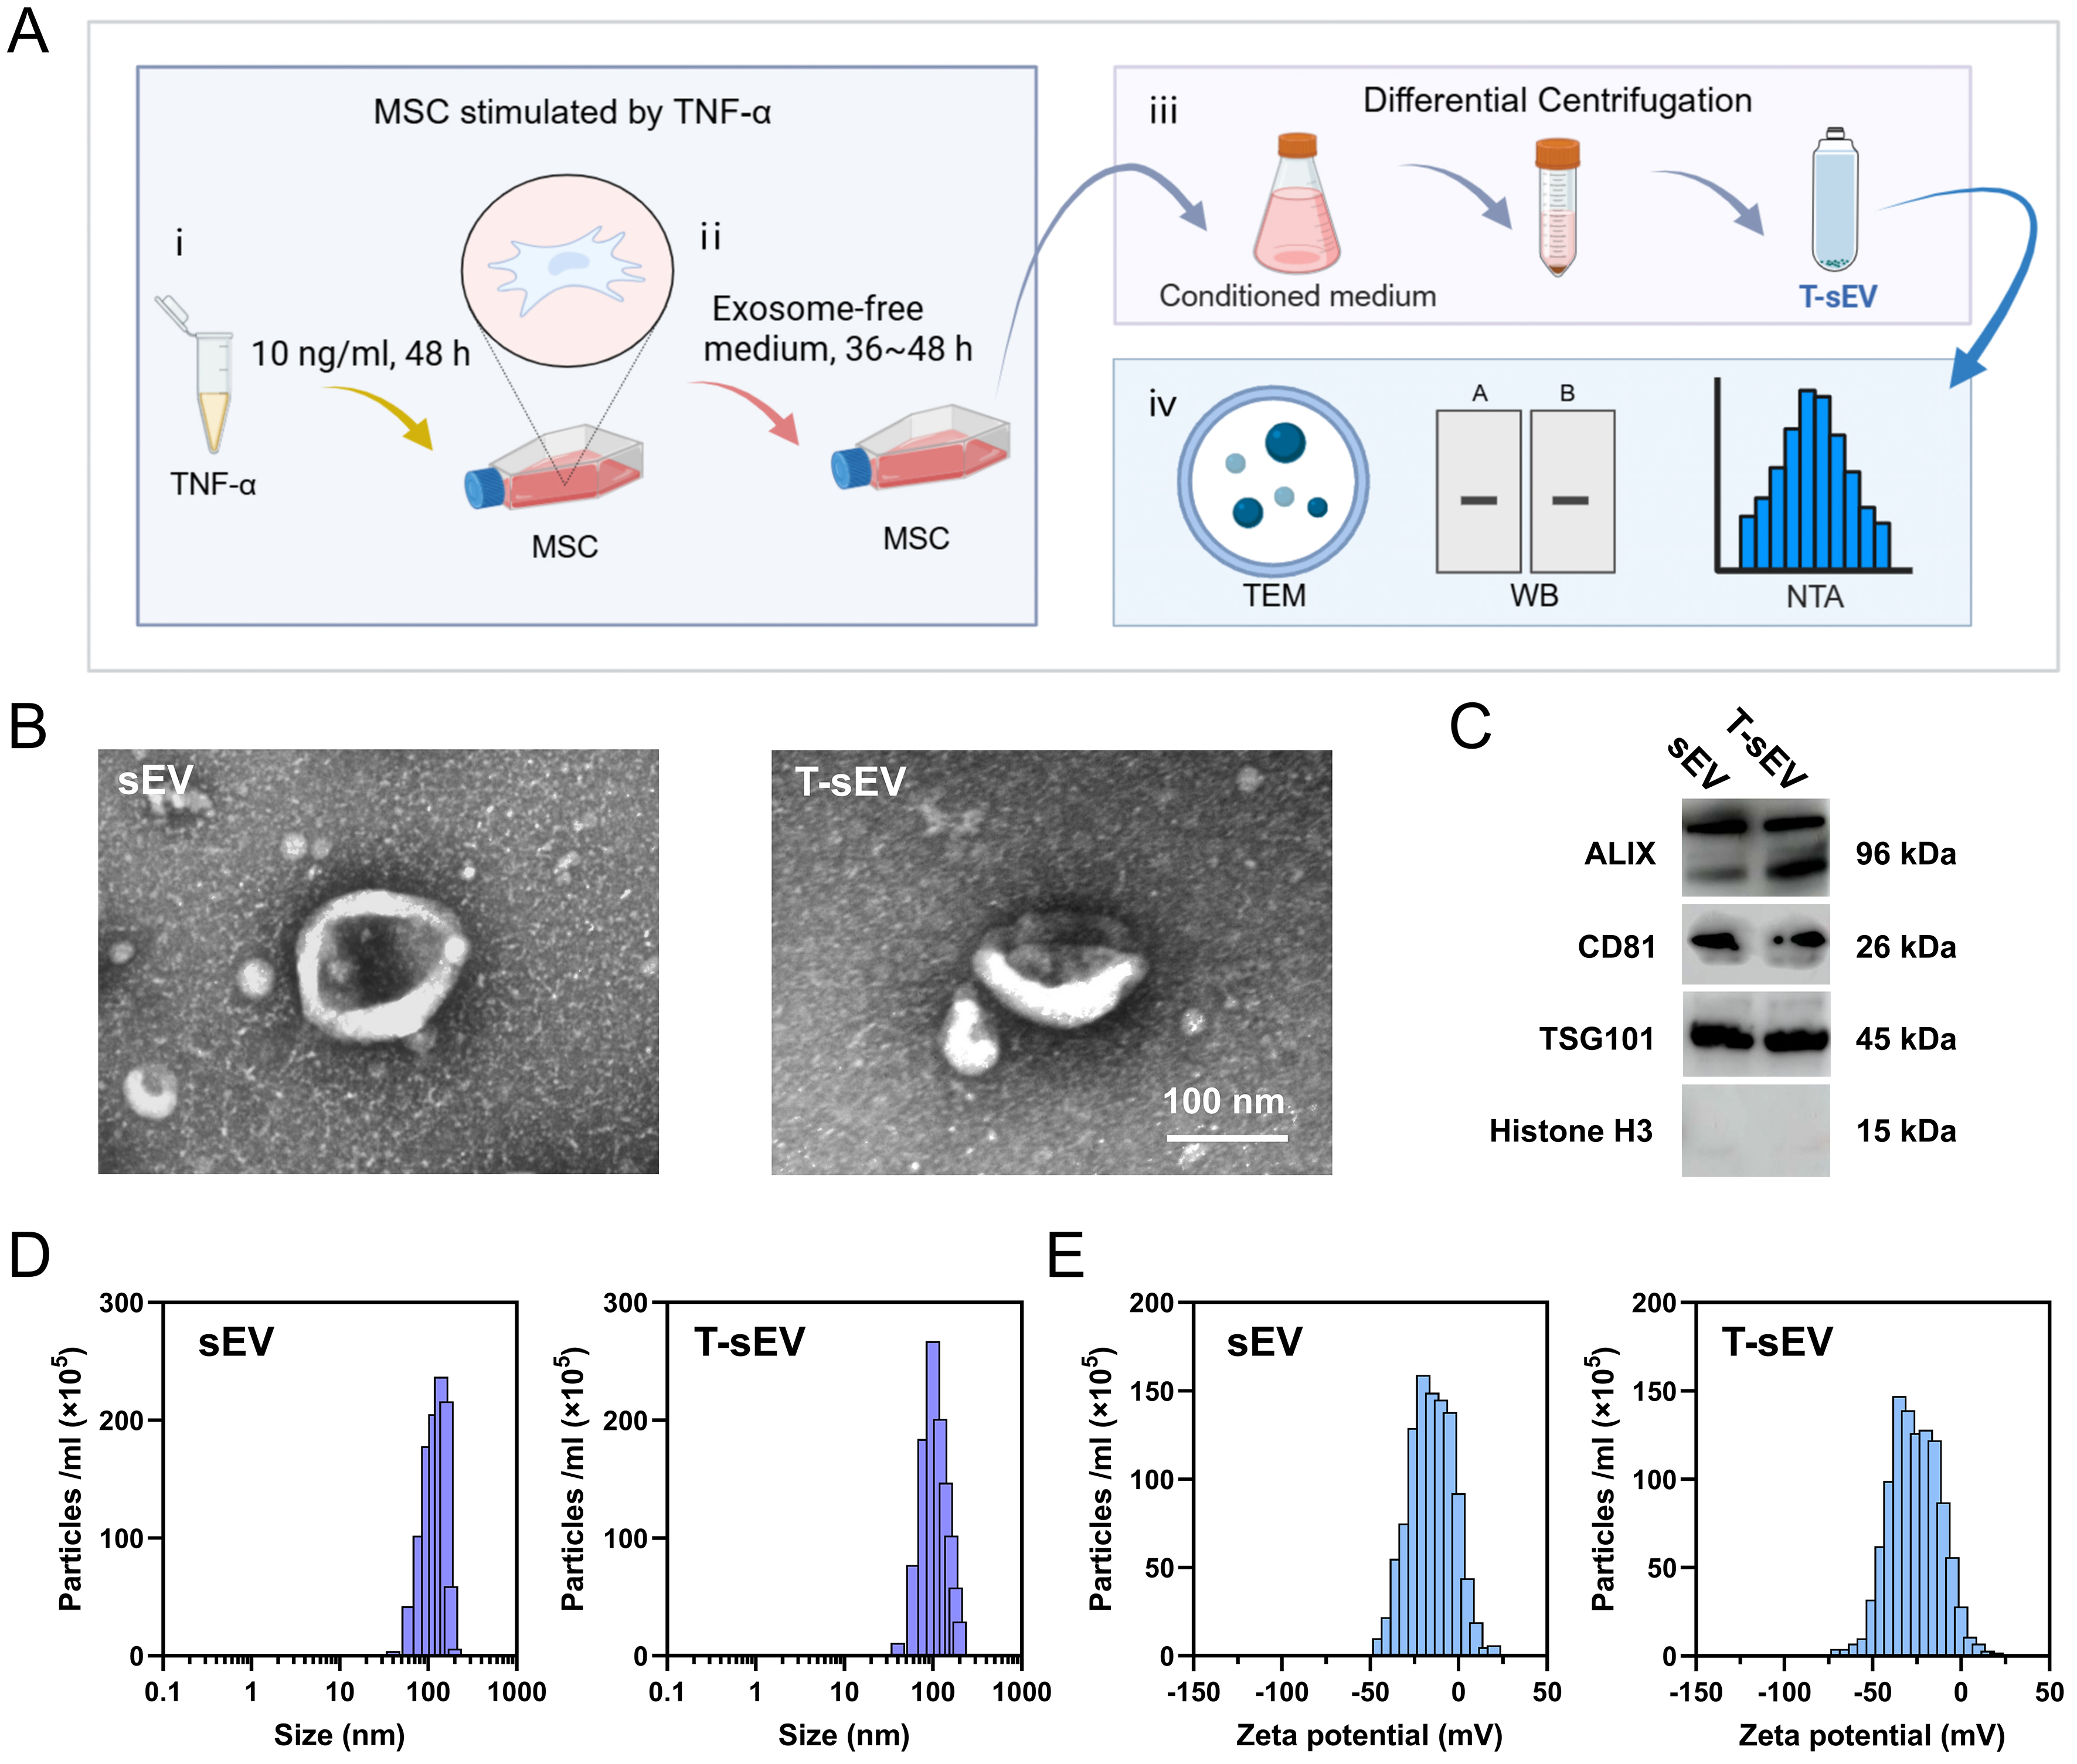
Figure 1. Extraction and characterization of T-sEV. (A) Schematic diagram outlining the key steps for T-sEV generation and analysis: (i) Priming of MSCs with TNF-α (10 ng/mL, 48 h); (ii) Culture in exosome-depleted serum; (iii) Isolation of T-sEV from conditioned medium by ultracentrifugation; (iv) Characterization of isolated T-sEV; (B) Representative TEM image of T-sEV. Scale bar: 100 nm; (C) Western blot analysis of T-sEV lysates probed for the indicated markers (ALIX, CD81, TSG101) and the negative control marker Histone H3; (D and E) NTA of control sEV and T-sEV showed size distribution (D) and characteristic surface charge (E). Figure 1A was created with BioRender.com, and its use complies with BioRender’s licensing agreement. MSC: Mesenchymal stem cell; sEV: small extracellular vesicles, representing vesicles from naive/unstimulated MSCs; T-sEV: sEV derived from TNF-α-primed MSCs; TEM: transmission electron microscopy; WB: western blot; NTA: nanoparticle tracking analysis.


