


fig7
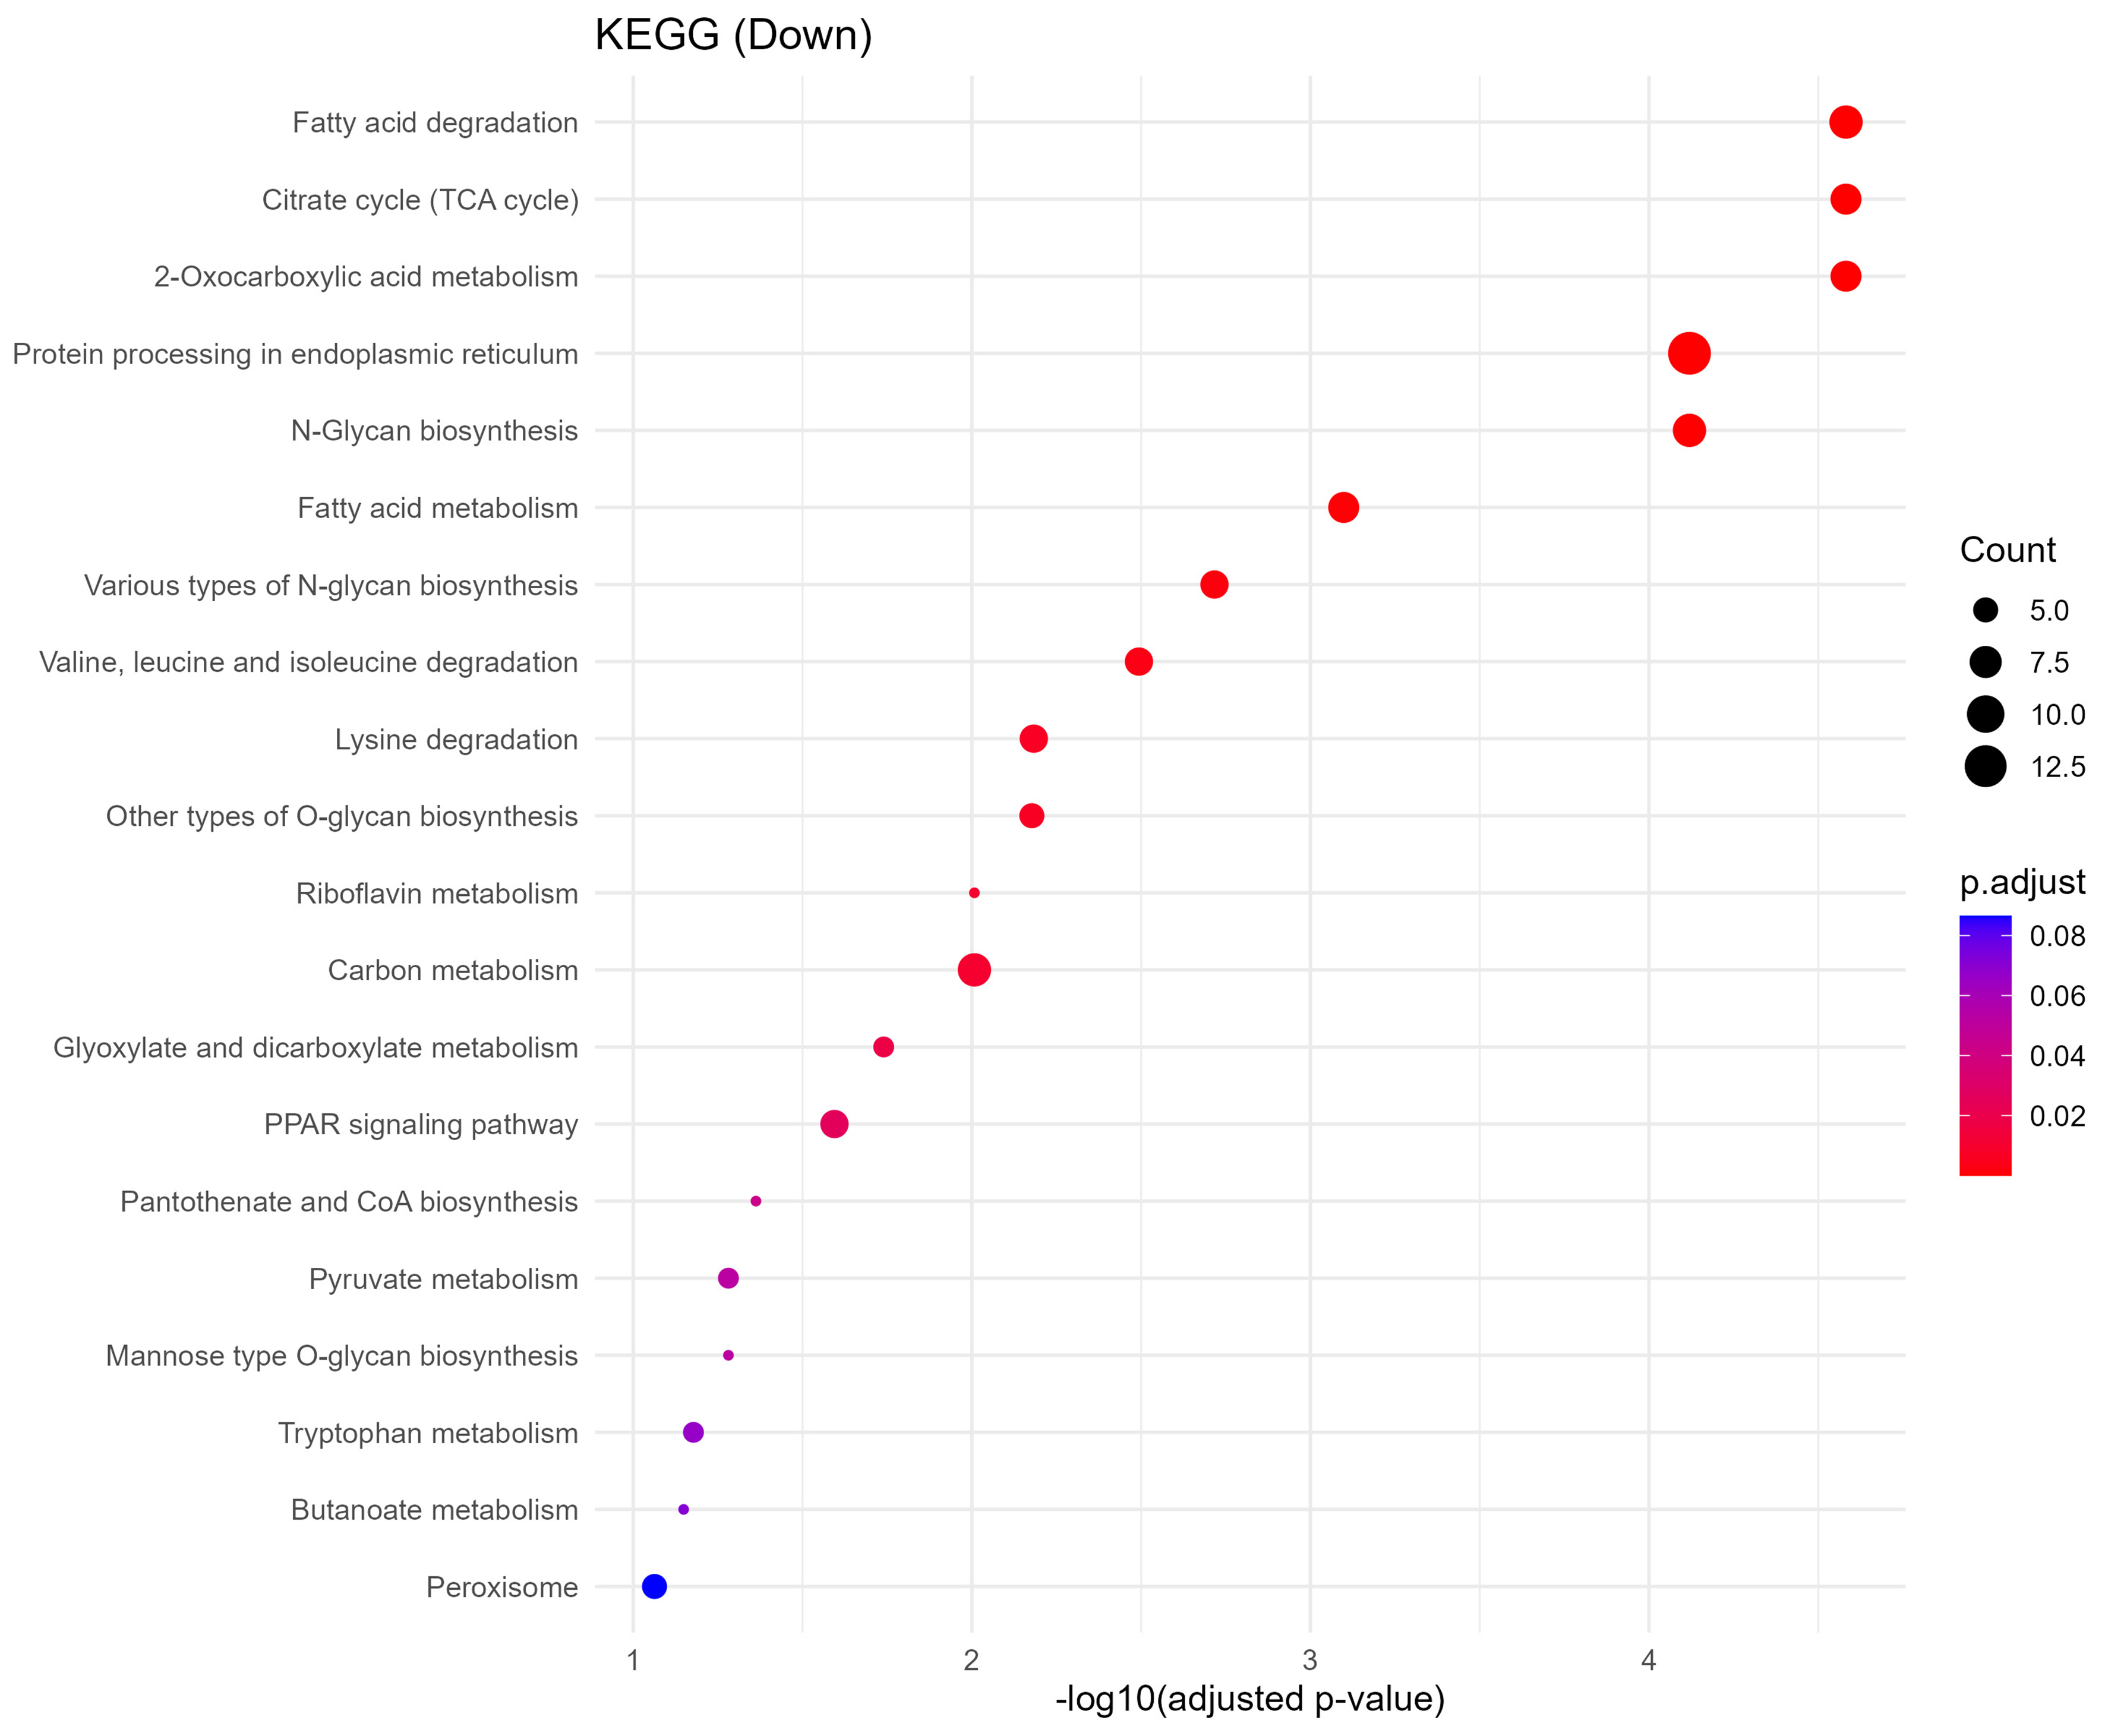
Figure 7. KEGG pathway enrichment of downregulated proteins. Dot plot displaying the top 20 significantly enriched KEGG pathways associated with downregulated sEV proteins. Notable pathways include fatty acid degradation, citrate cycle (TCA), and N-glycan biosynthesis, indicating disrupted energy metabolism and glycosylation. Dot size represents gene ratio, and color reflects -log10 P-value. KEGG: Kyoto Encyclopedia of Genes and Genomes; sEV: small extracellular vesicle; TCA: tricarboxylic acid.


