


fig6
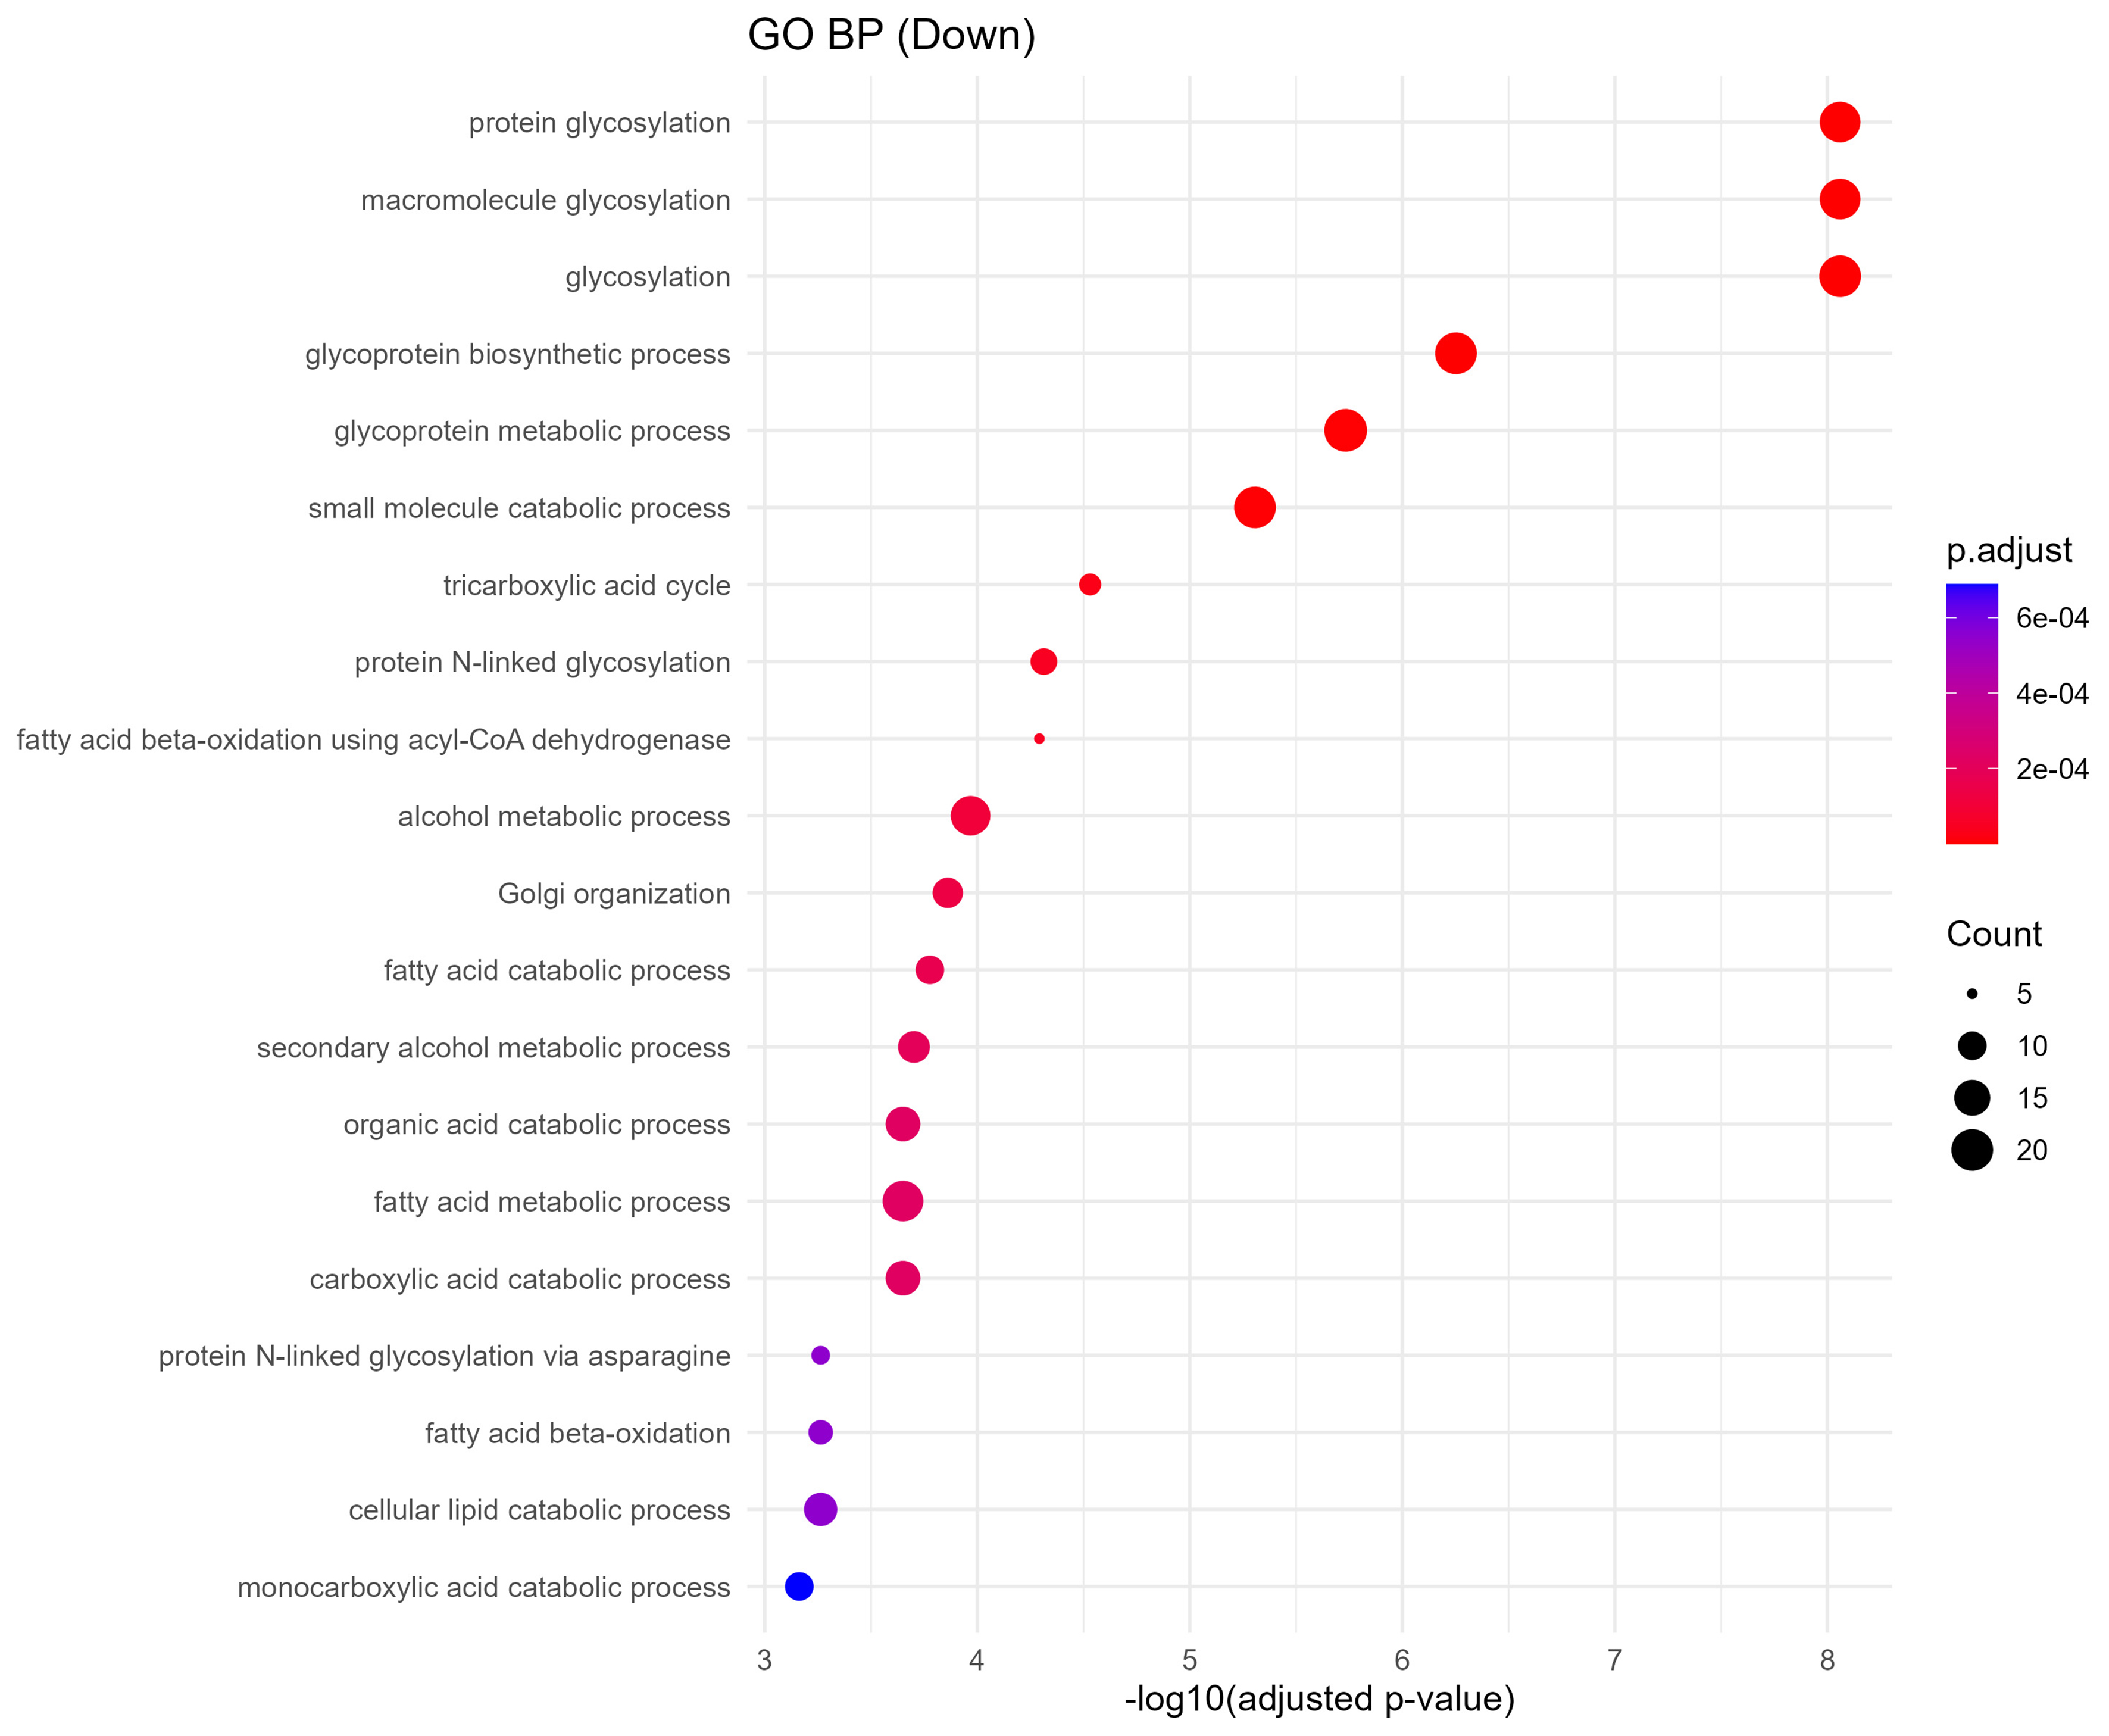
Figure 6. GO biological processes enrichment of downregulated proteins. Dot plot showing downregulated sEV protein-associated GO biological processes. Key disrupted processes include glycosylation, tricarboxylic acid cycle, fatty acid catabolism, and Golgi organization, indicating metabolic and glycoprotein-processing impairments. Dot size and color scale reflect gene ratio and statistical significance. GO: Gene Ontology; sEV: small extracellular vesicle; BP: biological process.


