


fig3
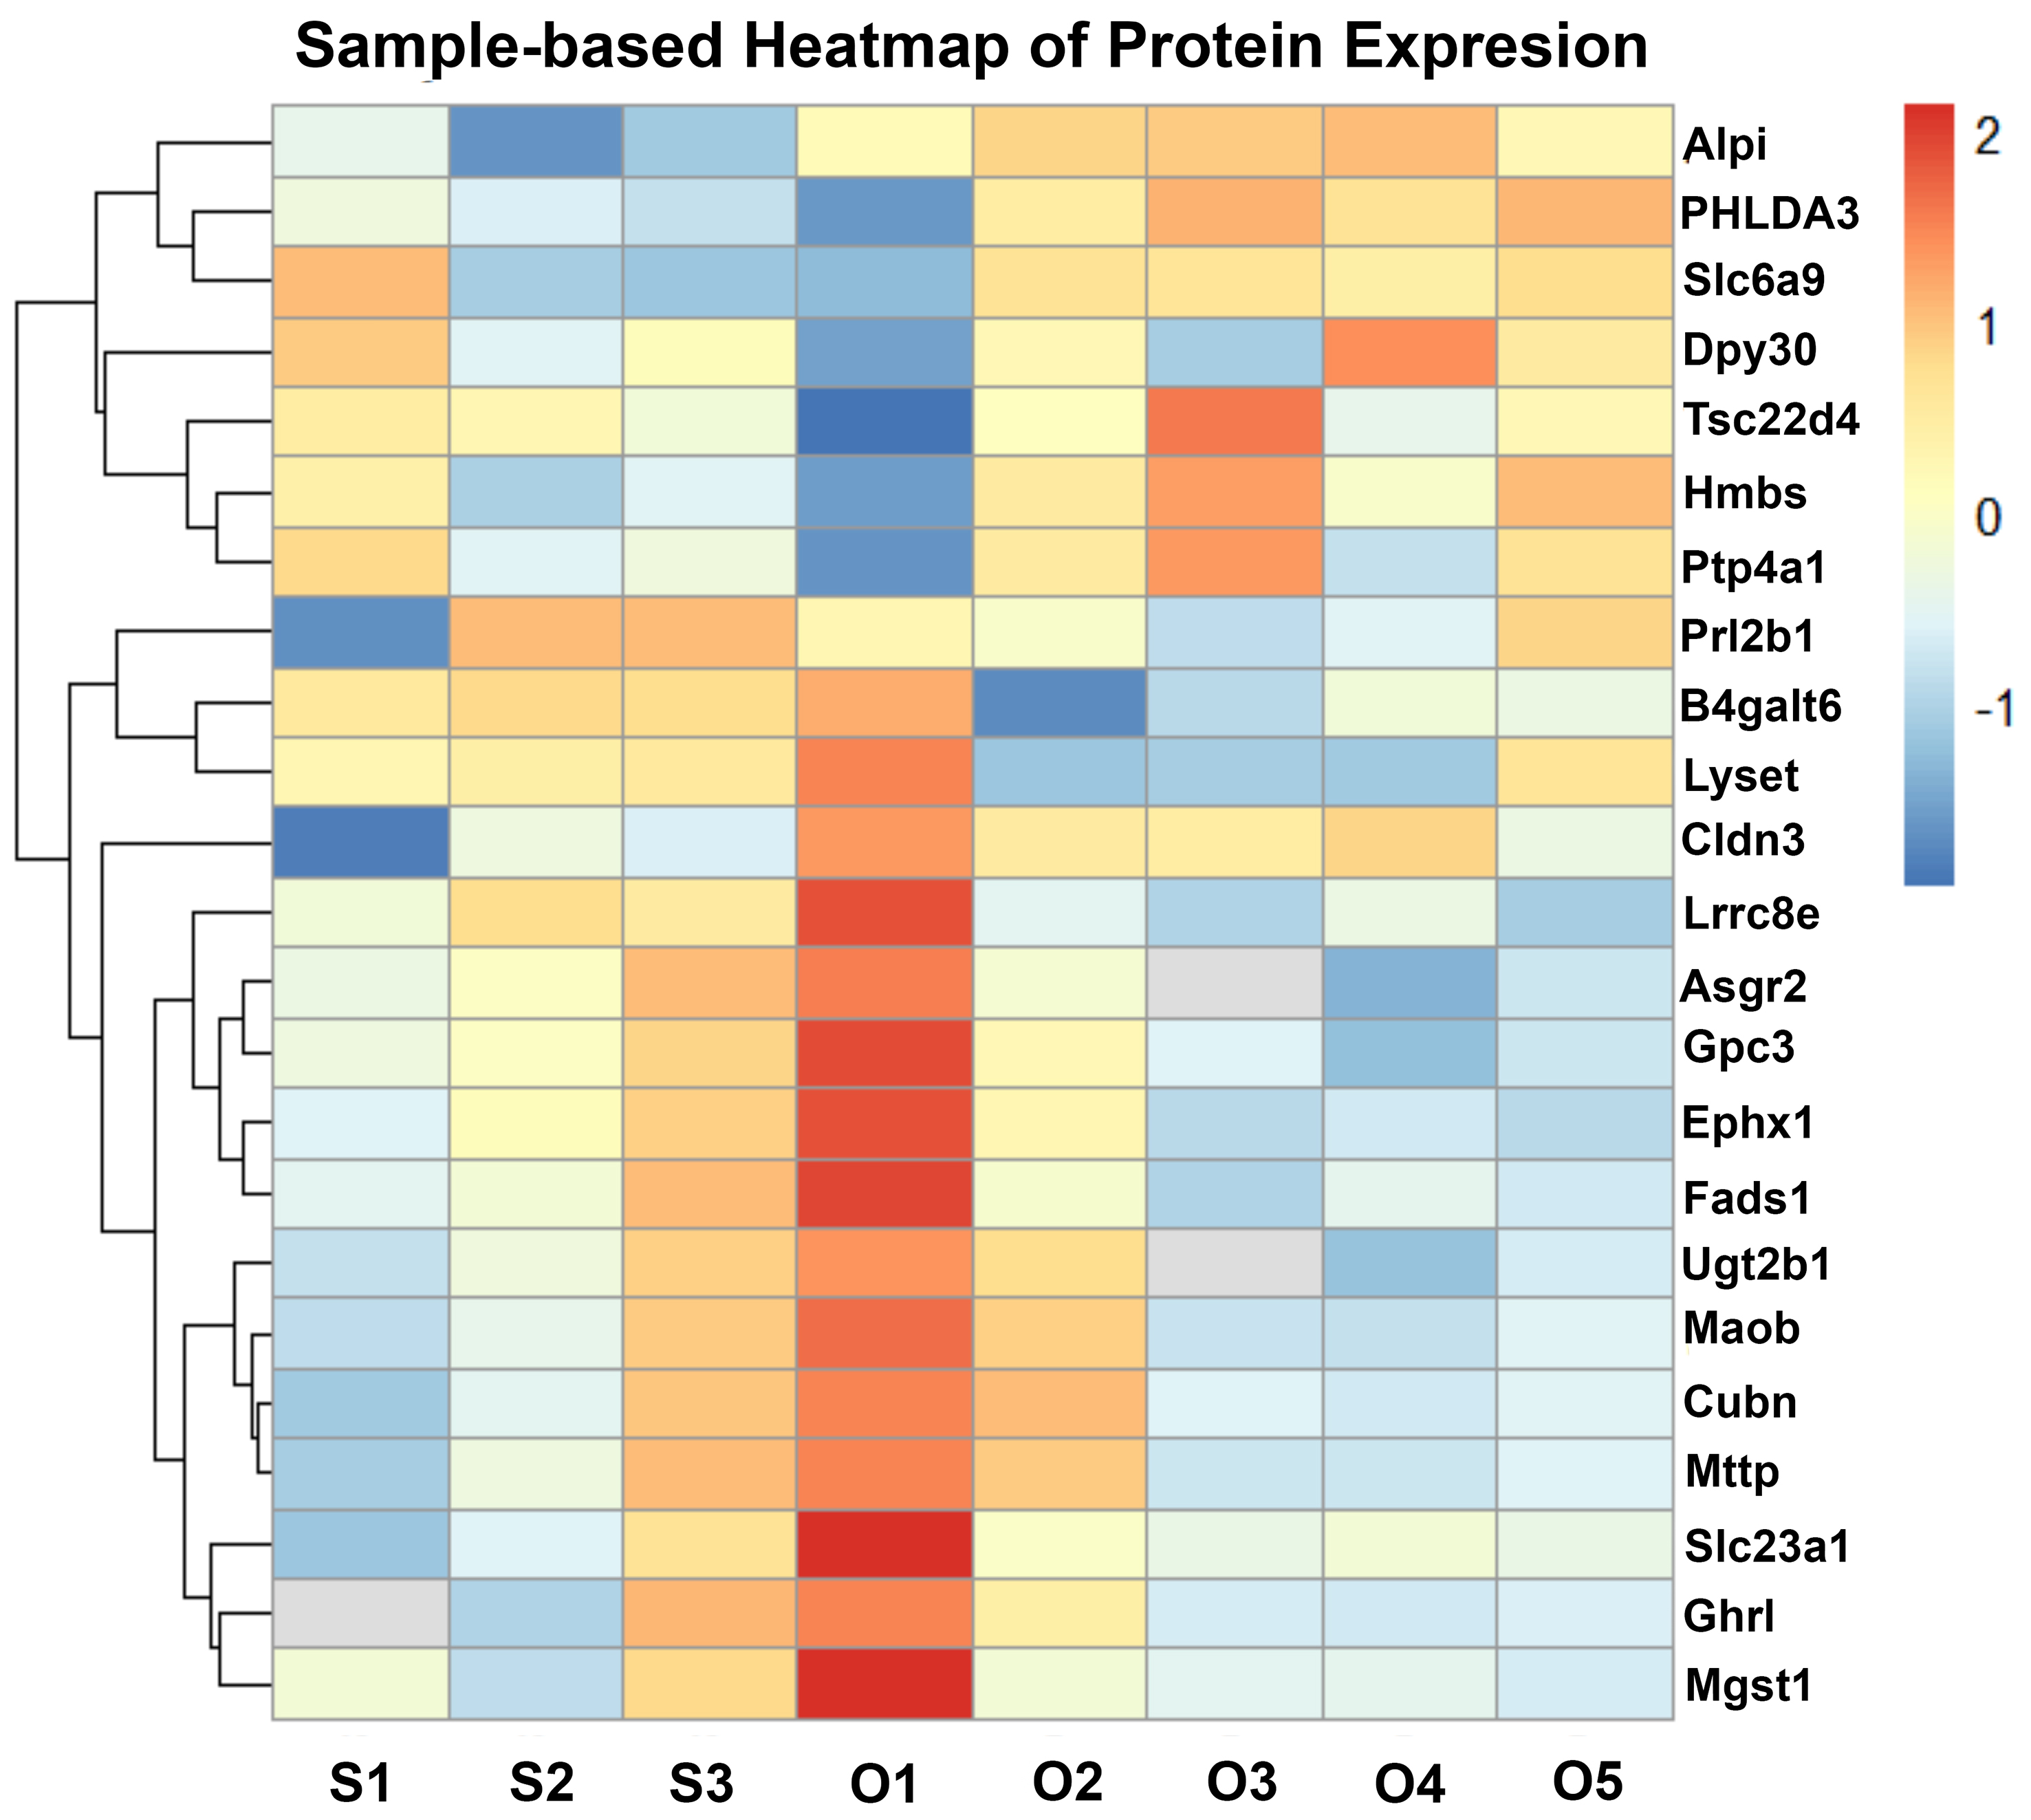
Figure 3. Oxycodone-induced changes in placental sEV protein expression. Sample-based heatmap showing z-score normalized protein expression across individual proteomics samples, with clear separation between saline and oxycodone groups. S indicates saline-derived EV samples (S1-S5) and O indicates oxycodone-derived EV samples (O1-O5); numeric suffixes denote individual biological replicate EV preparations included in the label-free proteomics analysis (not placenta numbering). Some within-group variability is observed, which is expected for biological replicates; however, overall clustering supports a consistent group-specific proteomic signature. sEV: Small extracellular vesicle.


