


fig2
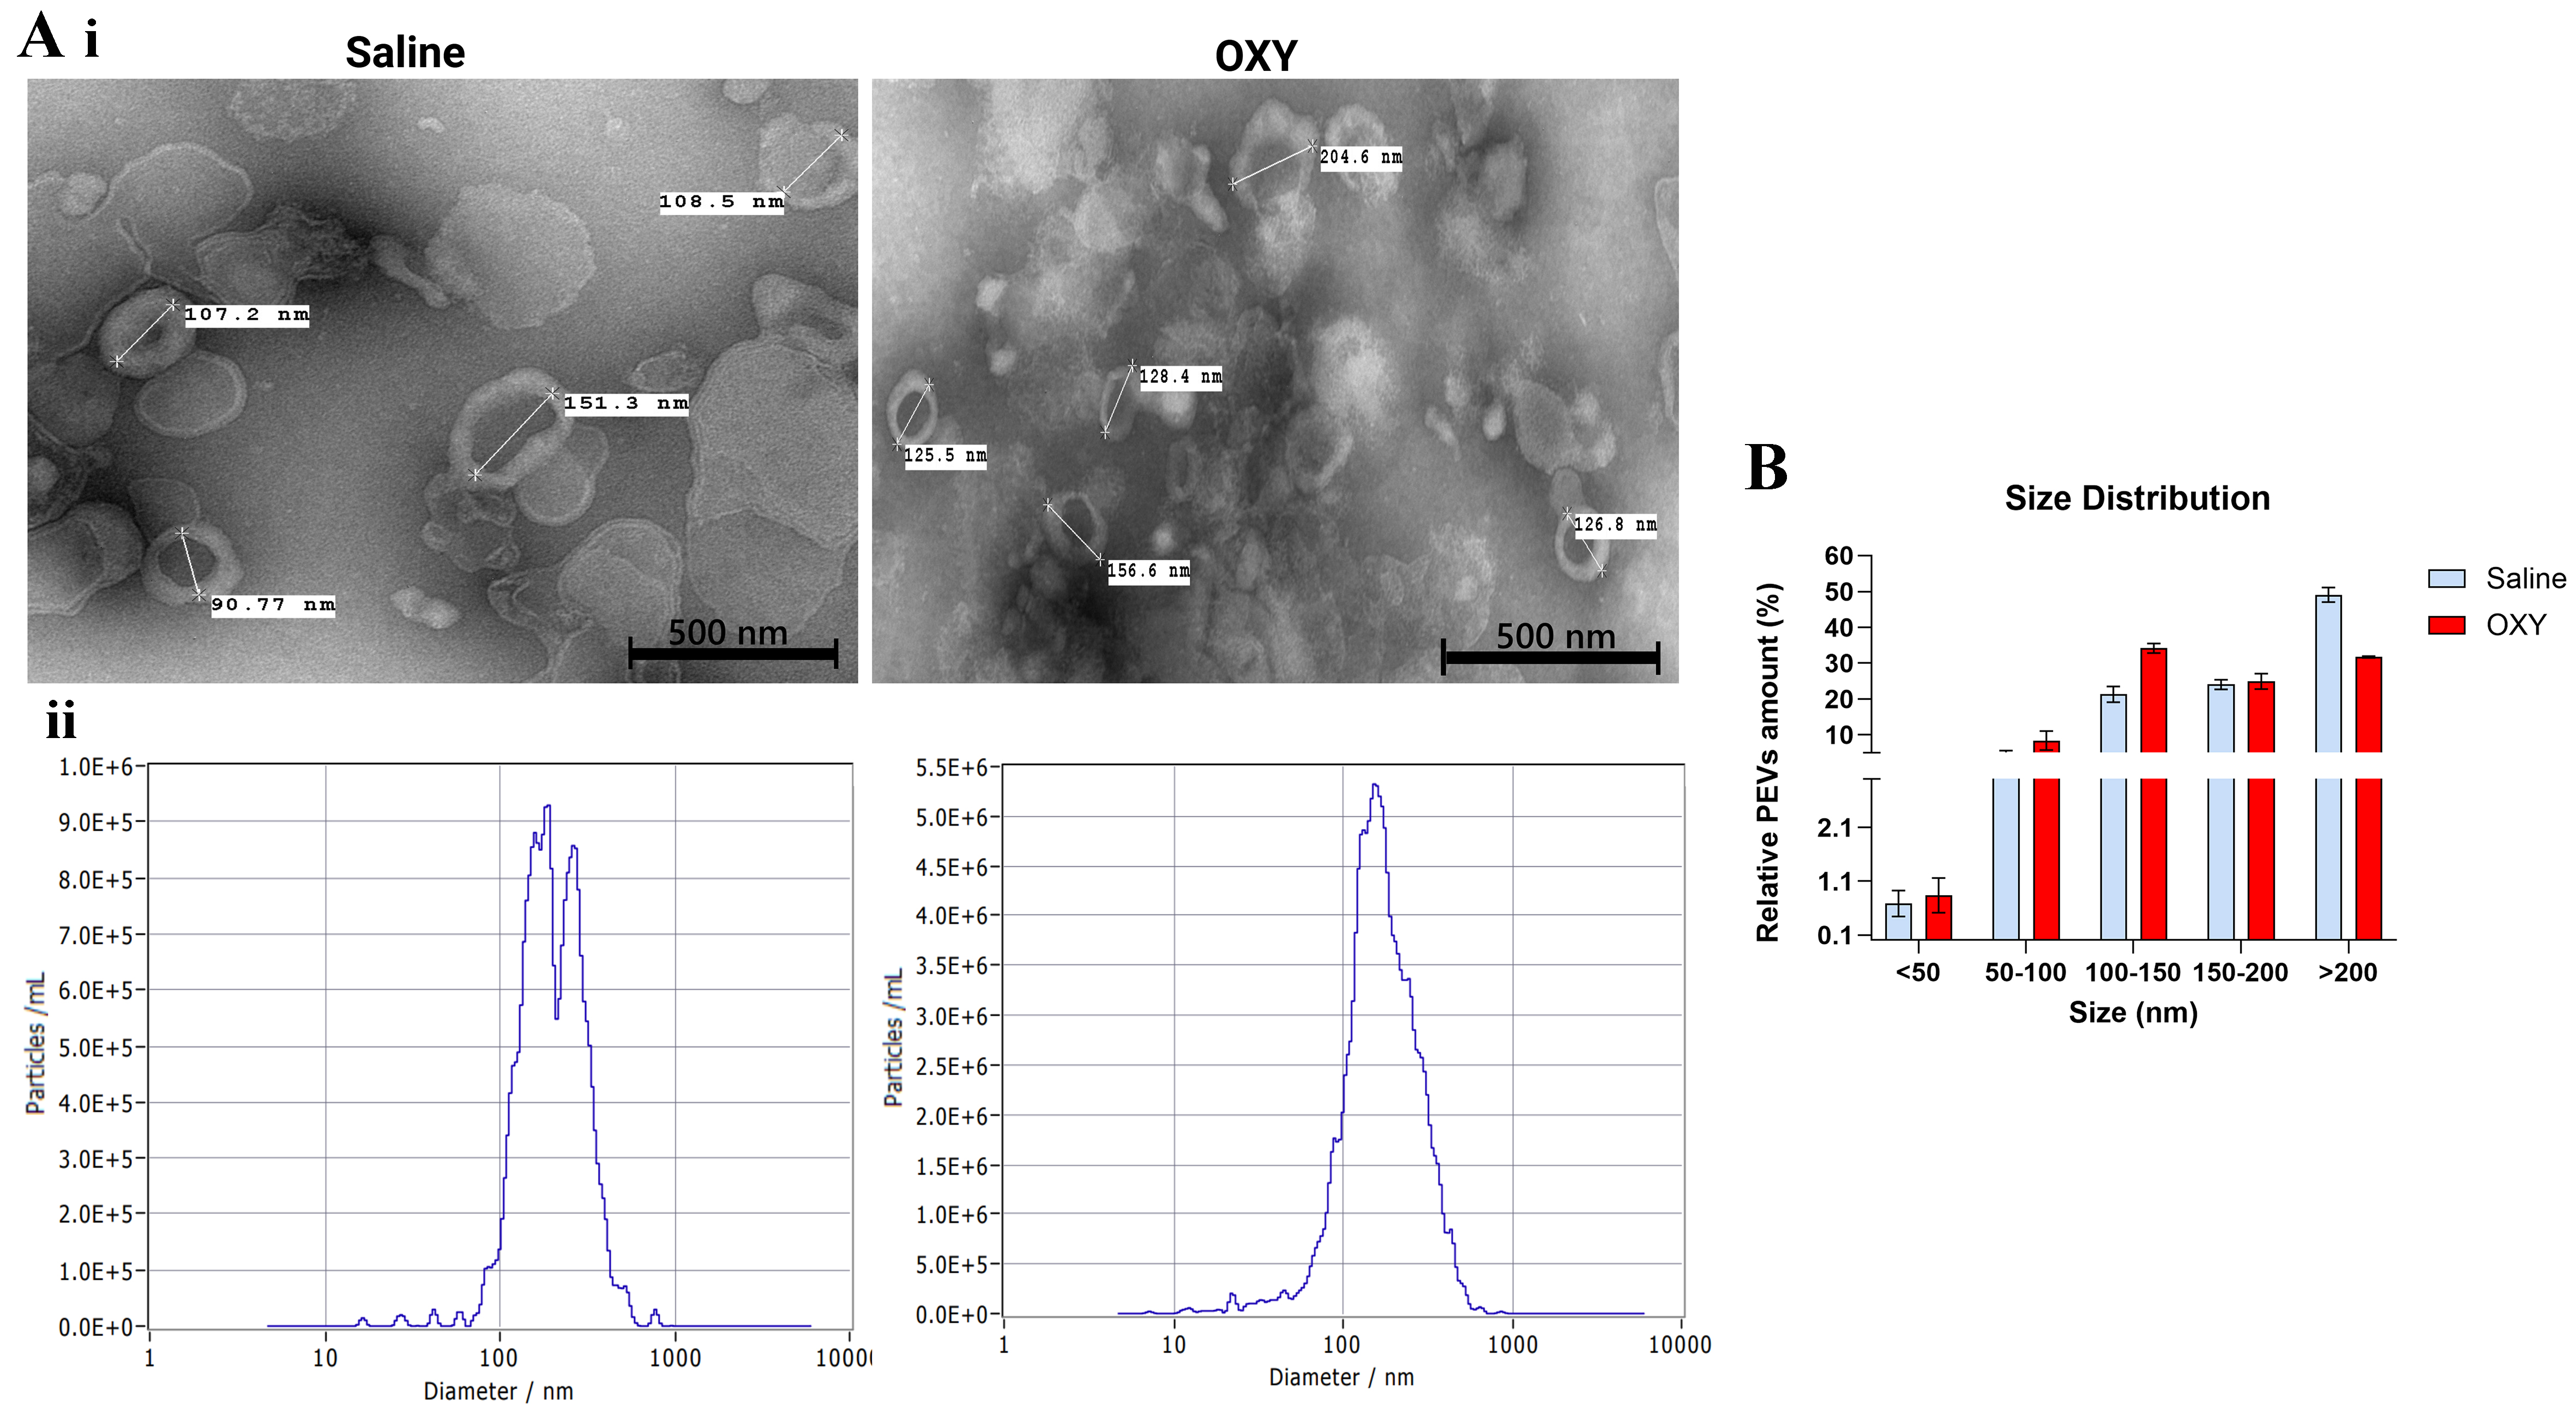
Figure 2. Oxycodone exposure alters the morphology and size distribution of PSEVs. [A(i)] TEM images show representative EVs isolated from placental tissue of saline-treated (left) and oxycodone-treated (right) groups. TEM provides qualitative visualization of vesicle morphology/size. [A(ii)] NTA (ZetaView) profiles show particle size distributions for each group, demonstrating a leftward shift in peak diameter in the oxycodone group, consistent with a higher proportion of smaller EVs; (B) Quantification of EV size distribution across binned size ranges shows increased relative abundance of 100-150 nm EVs and reduced abundance of > 200 nm vesicles in the oxycodone group compared to saline controls. Data are shown as mean ± SEM. Statistical comparisons were performed using an unpaired t-test with Welch’s correction. Oxycodone exposure induces differential protein expression in placental EVs. PSEVs: Placenta-derived small extracellular vesicles; TEM: transmission electron microscopy; EVs: extracellular vesicles; NTA: nanoparticle tracking analysis; SEM: standard error of the mean; OXY: Oxycodone.


