


fig2
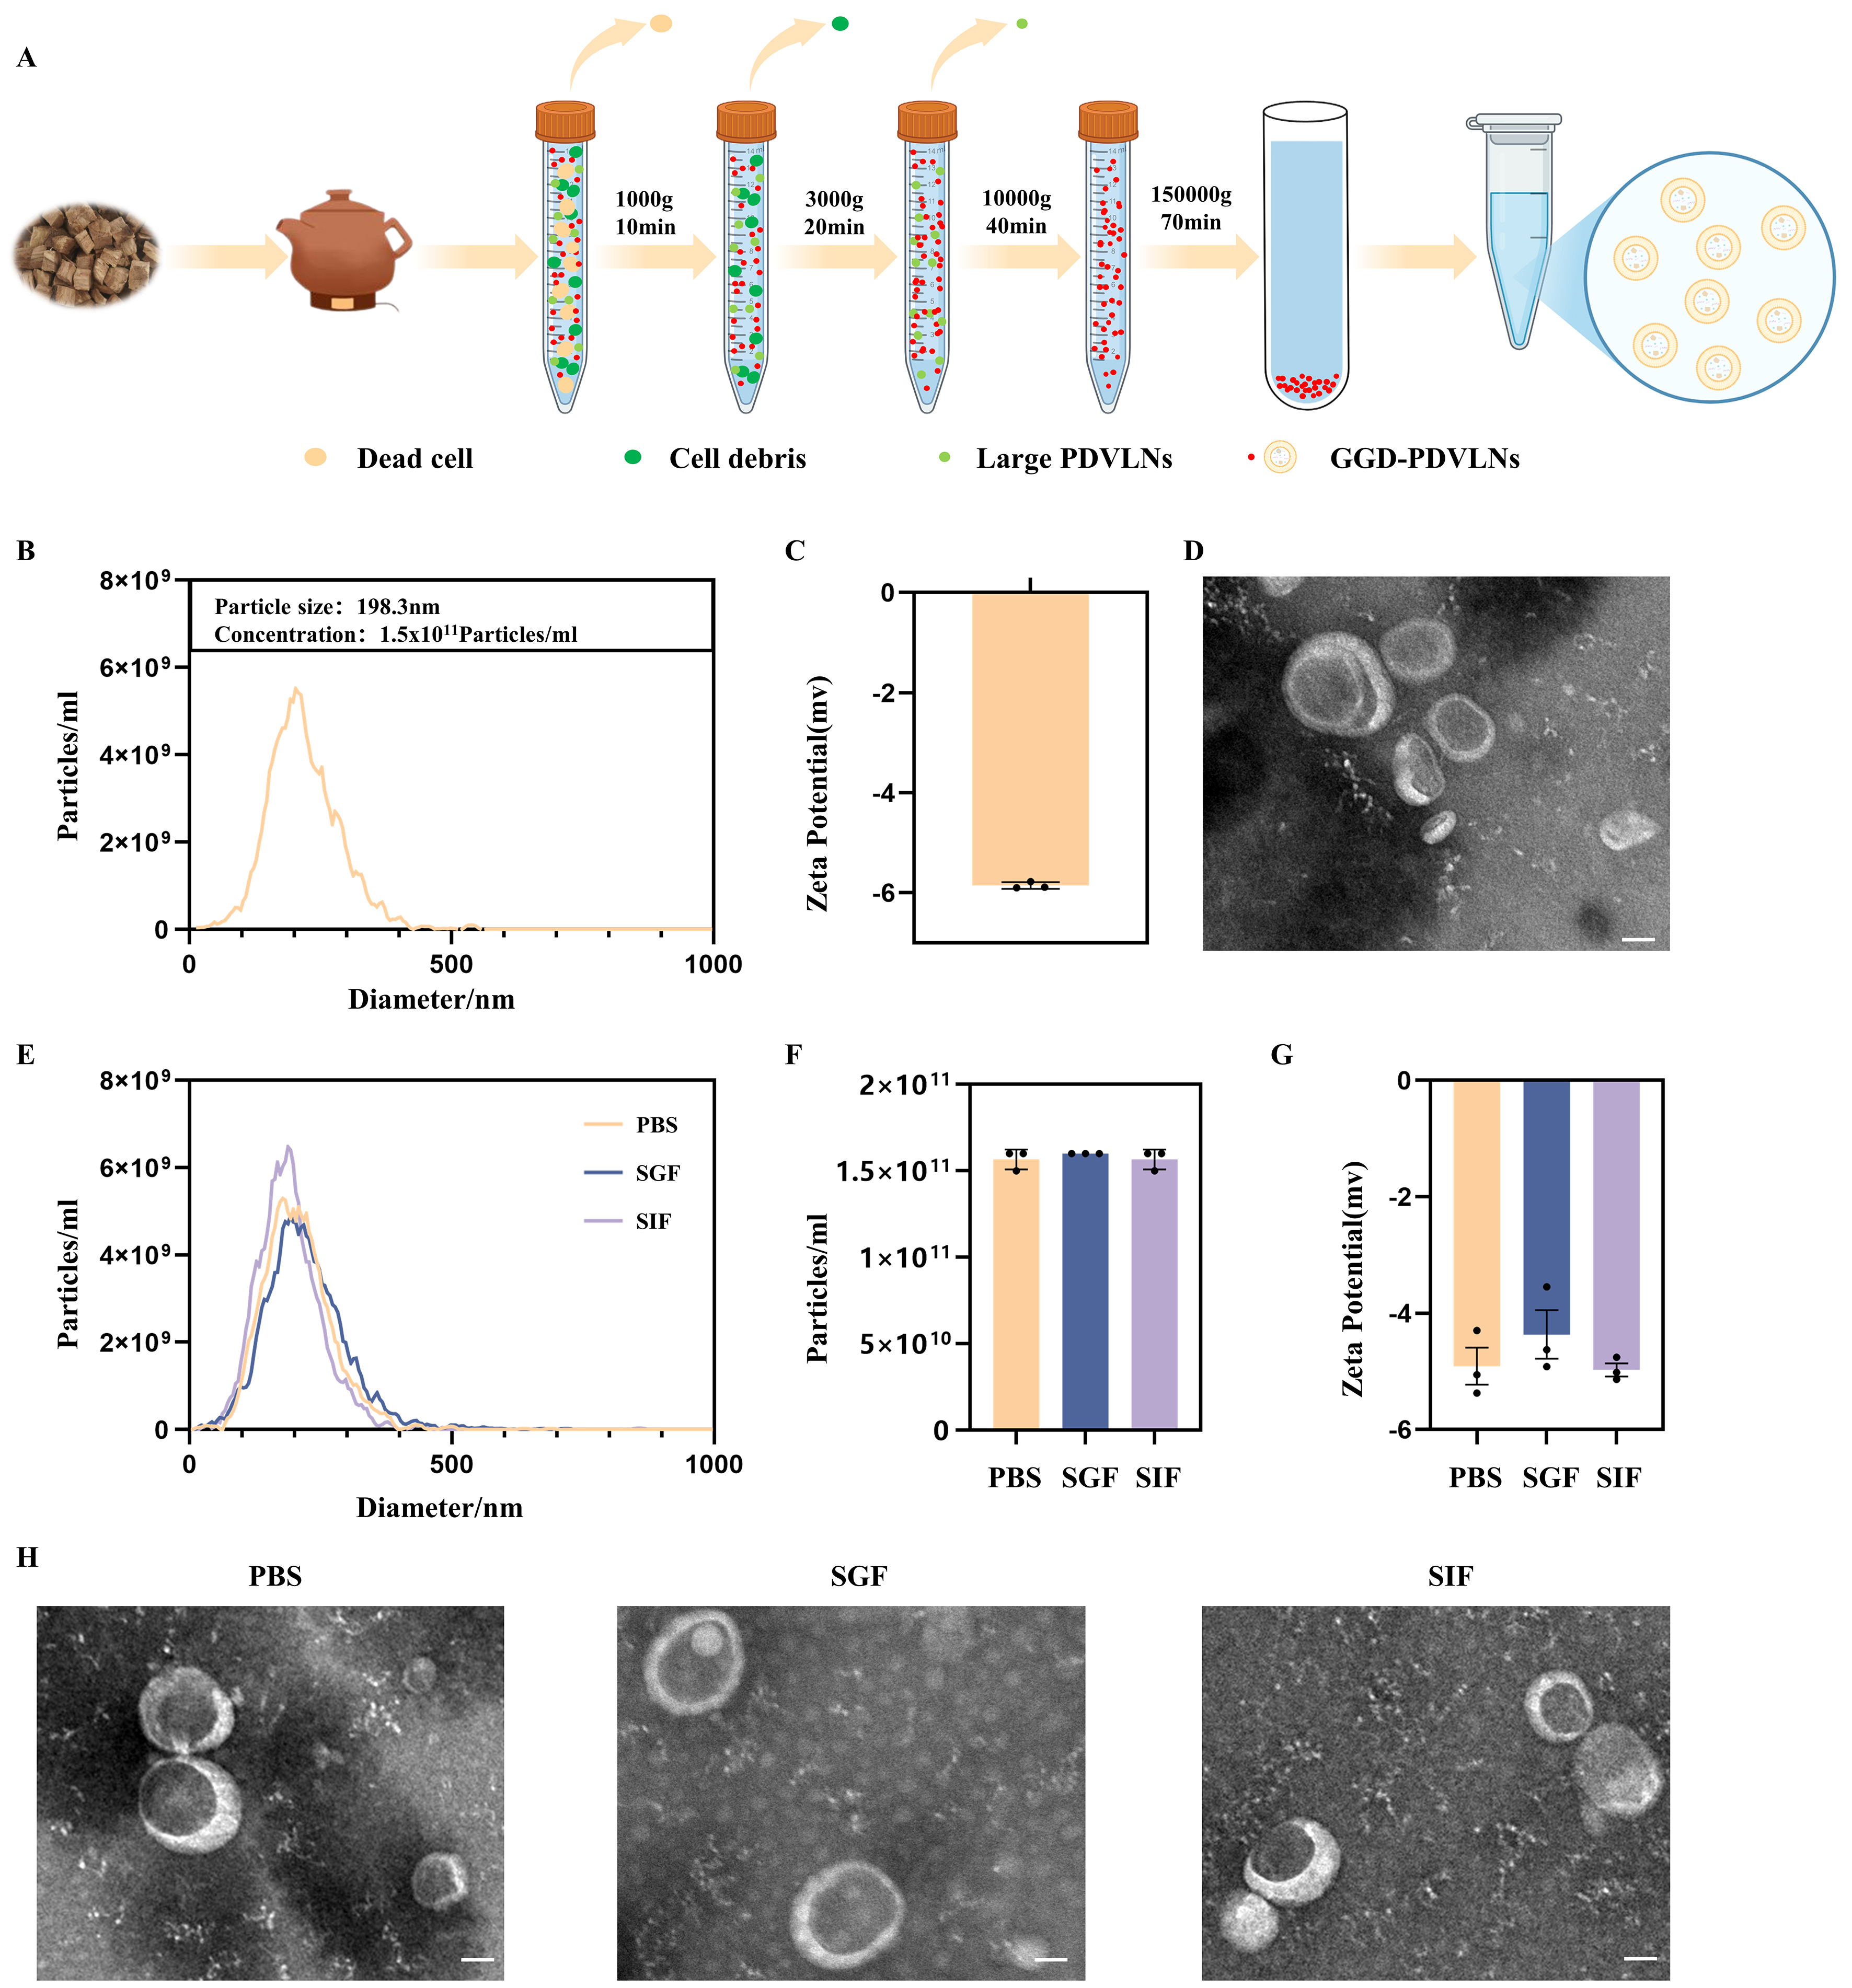
Figure 2. Isolation and characterization of GGD-PDVLNs. (A) The isolation and purification scheme of GGD-PDVLNs, created in BioRender. Yijuan, H. (2026) https://BioRender.com/01oosim; (B) NTA analysis; (C) Zeta potential; (D) TEM images (50 nm); (E-H) Particle size distribution, particle number change, zeta potential change, TEM images of GGD-PDVLNs after 2 h incubation in PBS, SGF, SIF. Data are shown as means ± SEM, n = 3. GGD-PDVLNs: GeGen decoction-derived vesicle-like nanoparticles; NTA: nanoparticle tracking analysis; TEM: transmission electron microscopy; PBS: phosphate-buffered saline; SGF: simulated gastric fluid; SIF: simulated intestinal fluid; SEM: standard error of the mean.


