


fig4
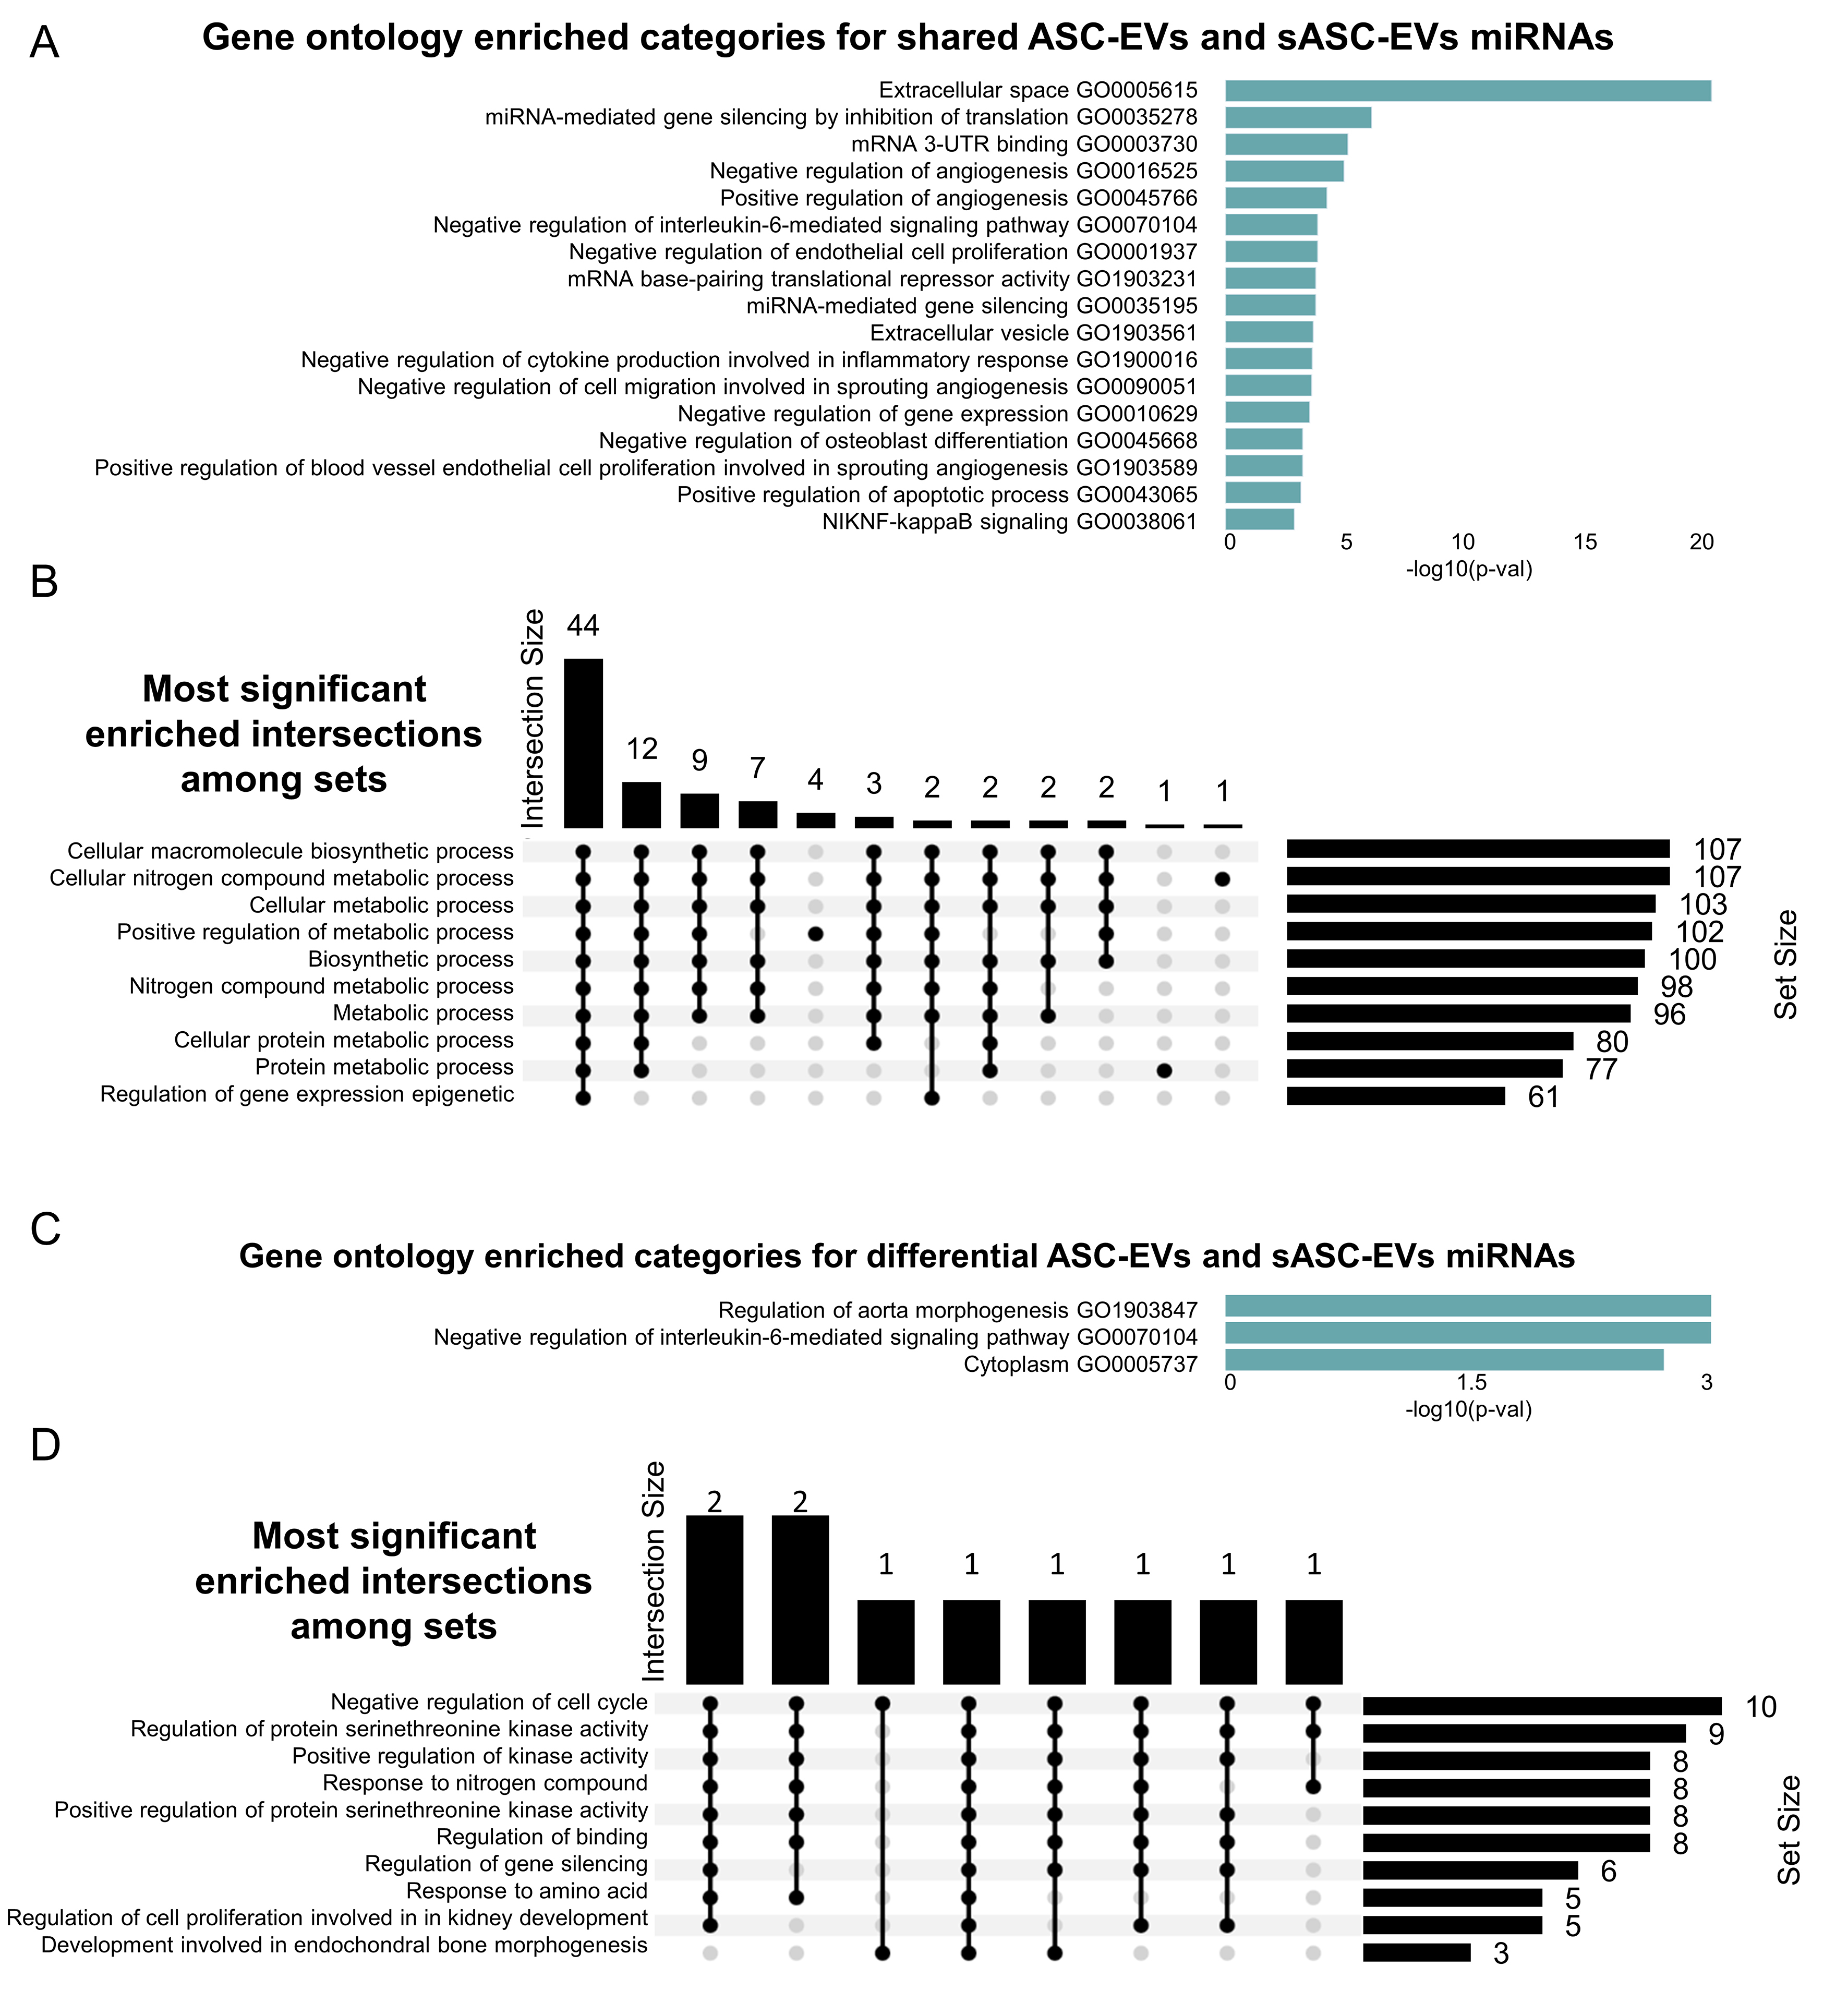
Figure 4. GO analysis of shared and differentially expressed miRNAs from ASC-EVs and sASC-EVs. (A) Bar chart of enriched GO categories for shared miRNAs, ranked by significance; (B) Upset plot showing the most significantly enriched intersections among sets. Horizontal bars on the left indicate the size of each individual set, while vertical bars represent the size of intersections between sets, as defined by the filled dots in the matrix. The height of each vertical bar corresponds to the number of elements in that intersection; (C) Bar chart of enriched GO categories for differentially expressed miRNAs, ranked by significance; (D) Upset plot of enriched intersections among sets for differentially expressed miRNAs, described as in (B). GO: Gene Ontology; miRNA: microRNA; ASC-EVs: adipose-derived stromal cell-derived extracellular vesicles; sASC-EVs: sorted adipose-derived stromal cell-derived extracellular vesicles.


