


fig3
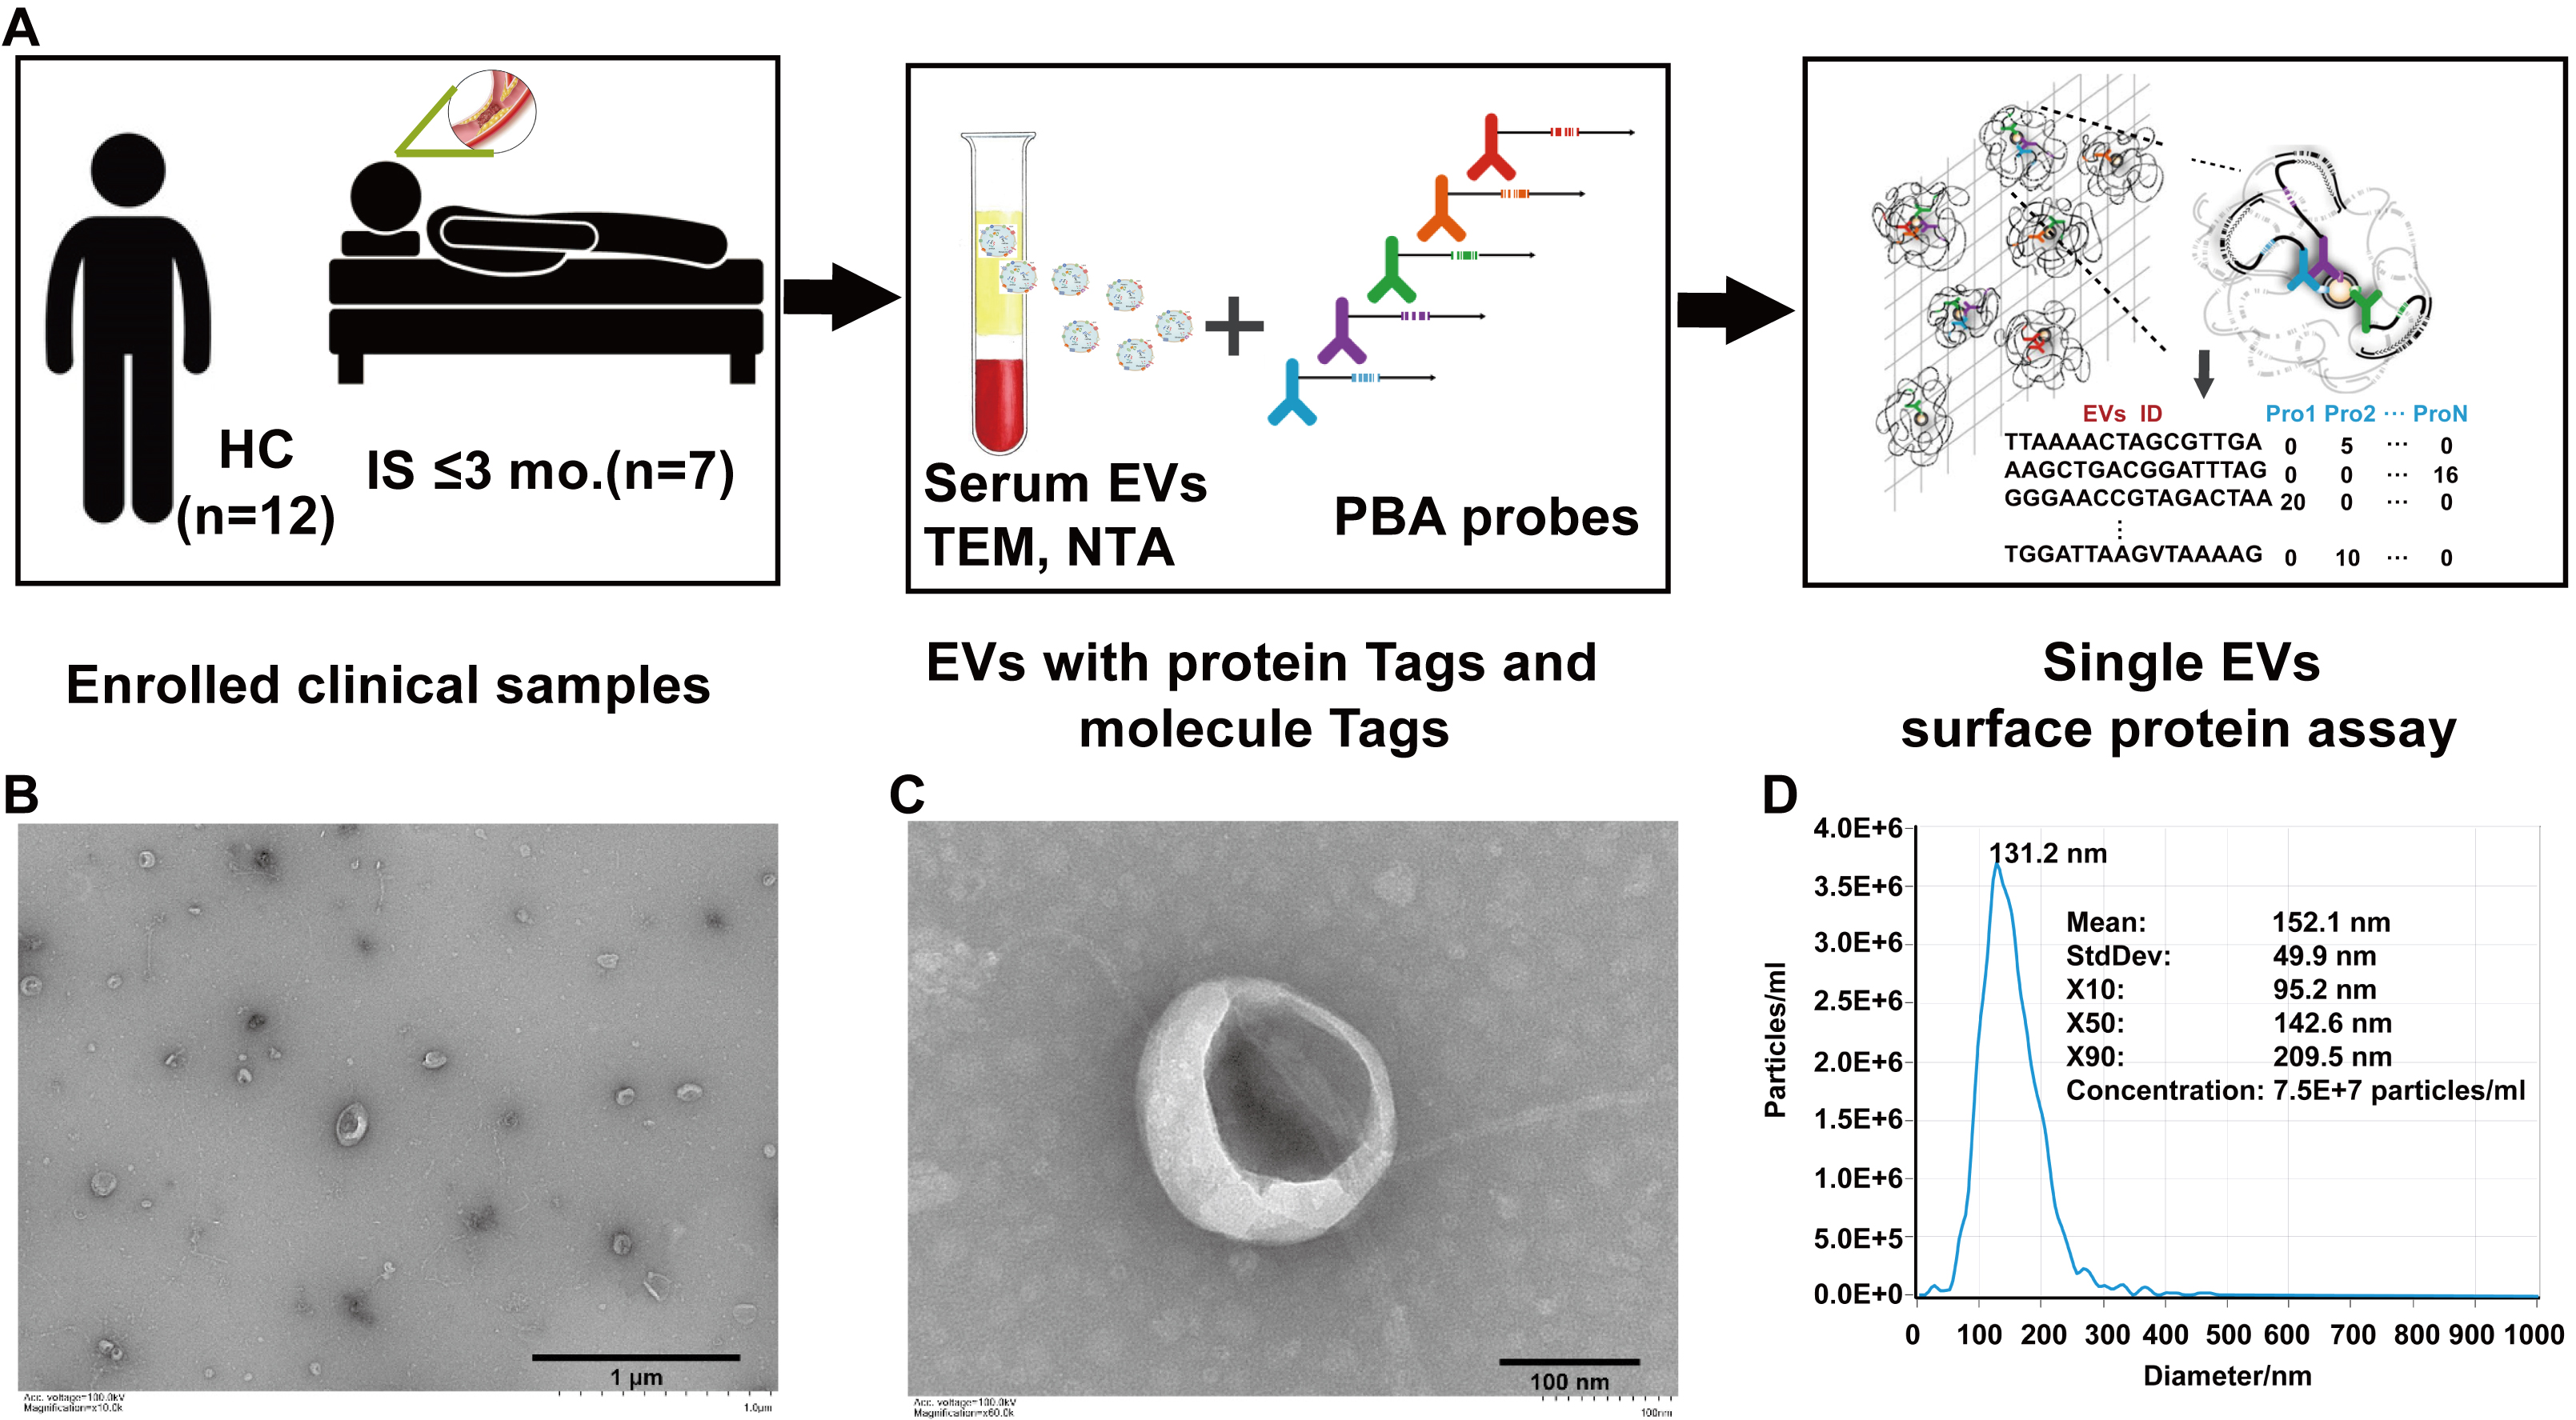
Figure 3. Profiling of IS-associated serum EVs surface proteins using PBA. (A) Flowchart of the study in the exploration subset. (B-C) Morphology of IS-associated serum EVs as recorded by TEM. Scale bars = 1 μm (B) and 100 nm (C). (D) NTA of serum-derived EVs from IS patients. The particle size distribution is presented as X10/X50/X90 (median diameter, X50). IS: Ischemic stroke; HCs: healthy controls; EVs: extracellular vesicles; TEM: transmission electron microscopy; NTA: nanoparticle tracking analysis; PBA: proximity barcoding assay.


