


fig6
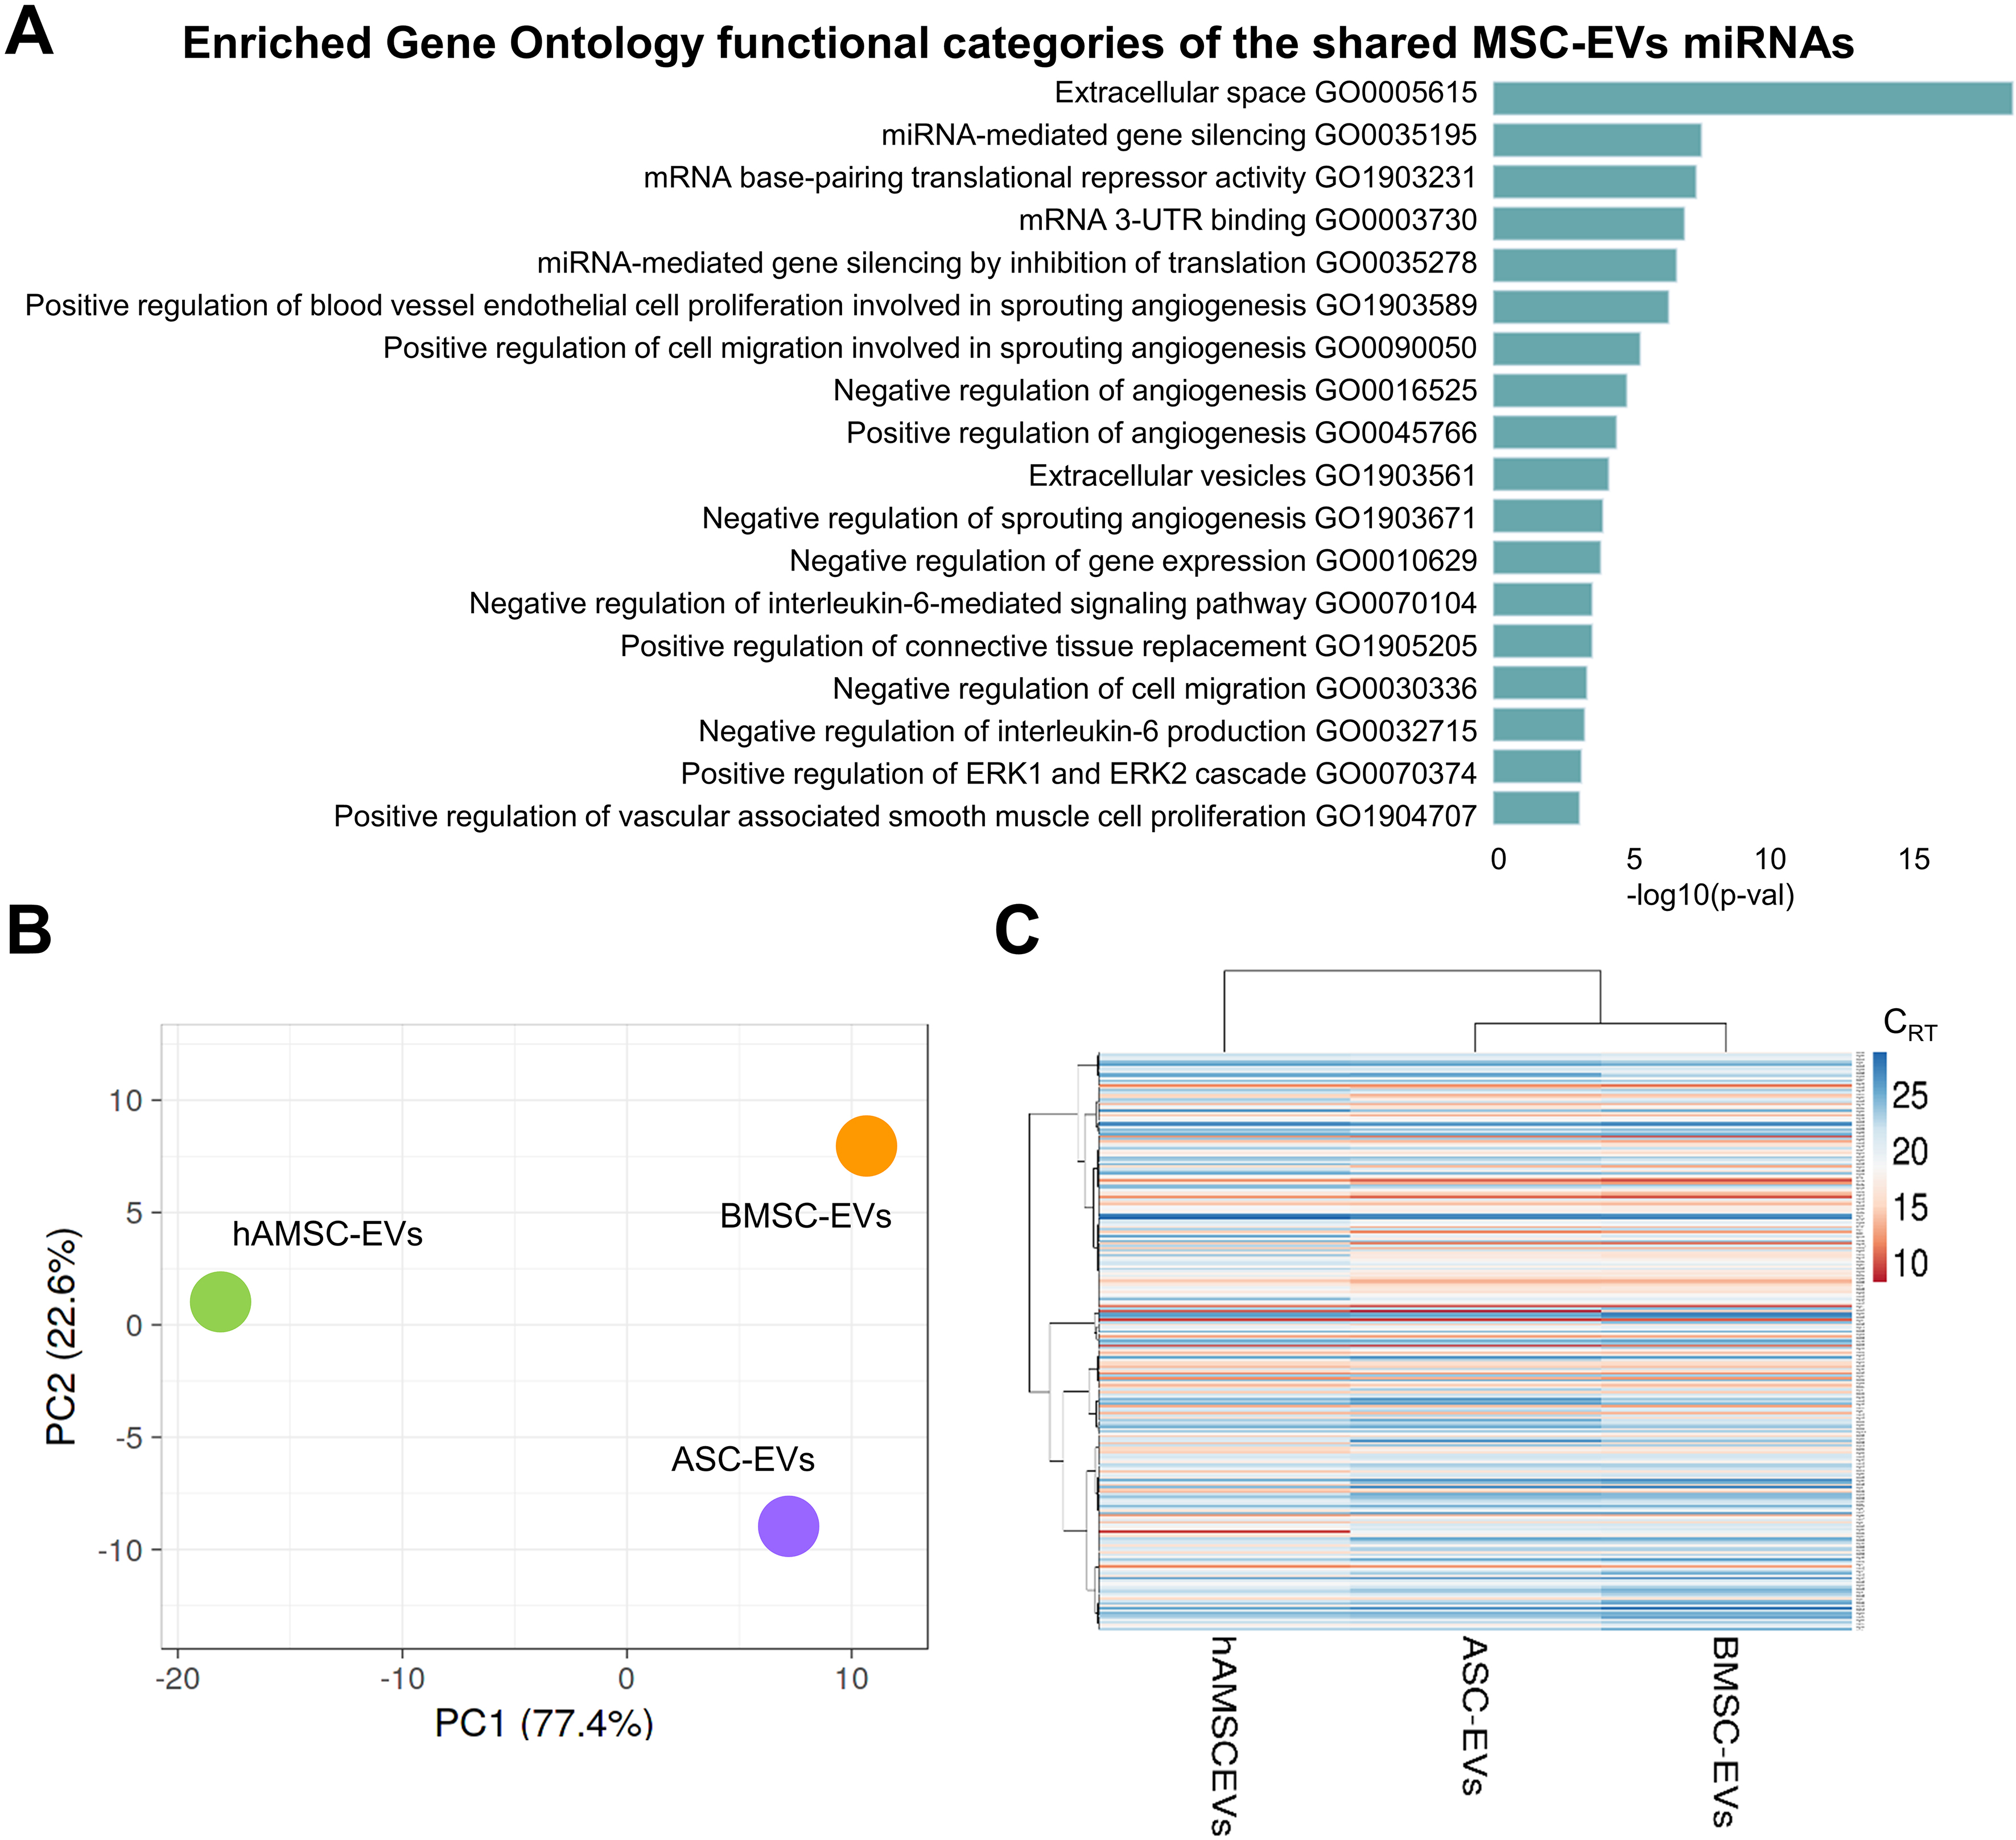
Figure 6. Comparison of EVs among MSC types under study. (A) Enriched GO functional categories of the shared MSC-EVs miRNAs. The vertical axis showed the GO category, and the horizontal axis showed the P-value (-log10); (B) Principal component analysis of the miRNA CRT values. The X and Y axes show PC1 and PC2, which explain 77.4% and 22.6% of the total variance, respectively; (C) Heat map of hierarchical clustering analysis of miRNA CRT values (mean of the three MSC-EVs samples for each type) with sample clustering tree at the top. Red shades: High expression levels; blue shades: low expression levels. Data presented in PowerPoint. MSC: Mesenchymal stromal cell; EVs: extracellular vesicles; ASC-EVs: extracellular vesicles derived from adipose-derived mesenchymal stromal cells; BMSC-EVs: extracellular vesicles derived from bone marrow-derived mesenchymal stromal cells; hAMSC-EVs: extracellular vesicles derived from human amniotic mesenchymal stromal cells; miRNA: microRNA; GO: Gene Ontology; PCA: principal component analysis; PC1: principal component 1; PC2: principal component 2; CRT: cycle relative threshold; ERK: extracellular signal-regulated kinase; UTR: untranslated region.


