


fig4
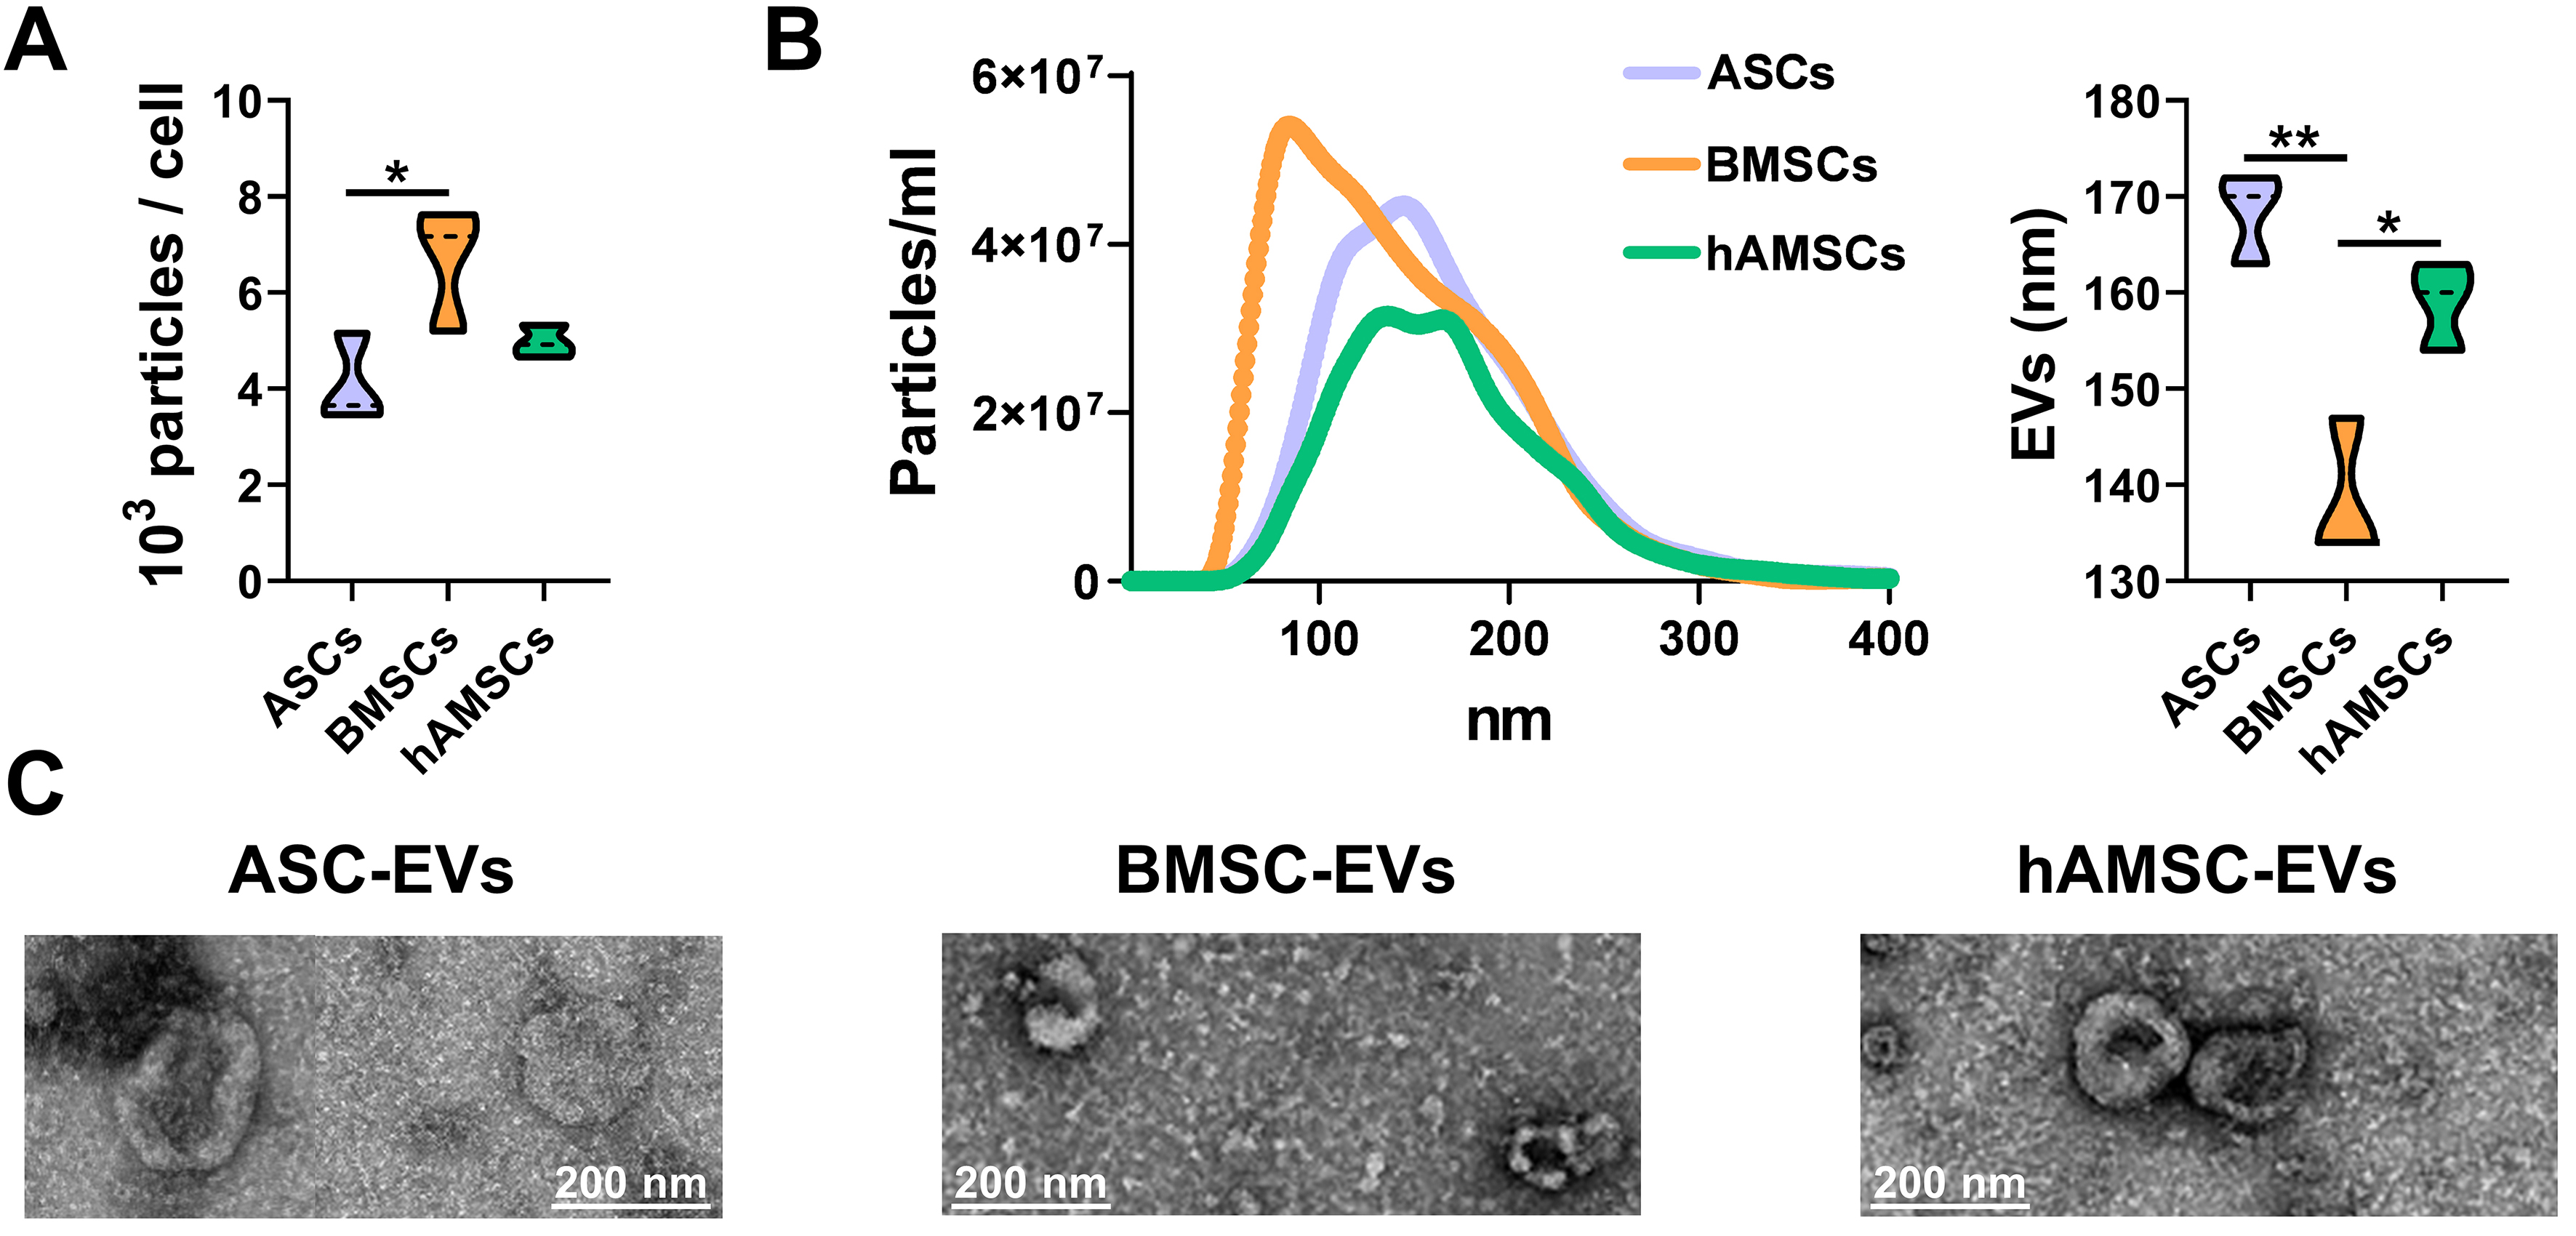
Figure 4. MSC-EV characterization. (A) Particles released per cell calculated from NTA data (N = 3; *P ≤ 0.05). After assessment of normality of data distribution by the Shapiro-Wilk test, statistical significance was determined using ANOVA; (B) Particle size analysis using NTA (each curve was obtained by merging the data from three independent MSC-type donors). Mean size results are displayed as violin plots (N = 3; *P ≤ 0.05, **P ≤ 0.01). After assessment of normality of data distribution by the Shapiro-Wilk test, statistical significance was determined using one-way ANOVA; (C) Transmission electron microscopy images of particles released by ASC, BMSCs and hAMSCs. Scale bar is included in each micrograph. Data presented in PowerPoint. MSC: Mesenchymal stromal cell; ASC: adipose-derived mesenchymal stromal cell; BMSC: bone marrow-derived mesenchymal stromal cell; hAMSC: human amniotic mesenchymal stromal cell; EVs: extracellular vesicles; NTA: nanoparticle tracking analysis; TEM: transmission electron microscopy; ANOVA: analysis of variance; nm: nanometer.


