


fig3
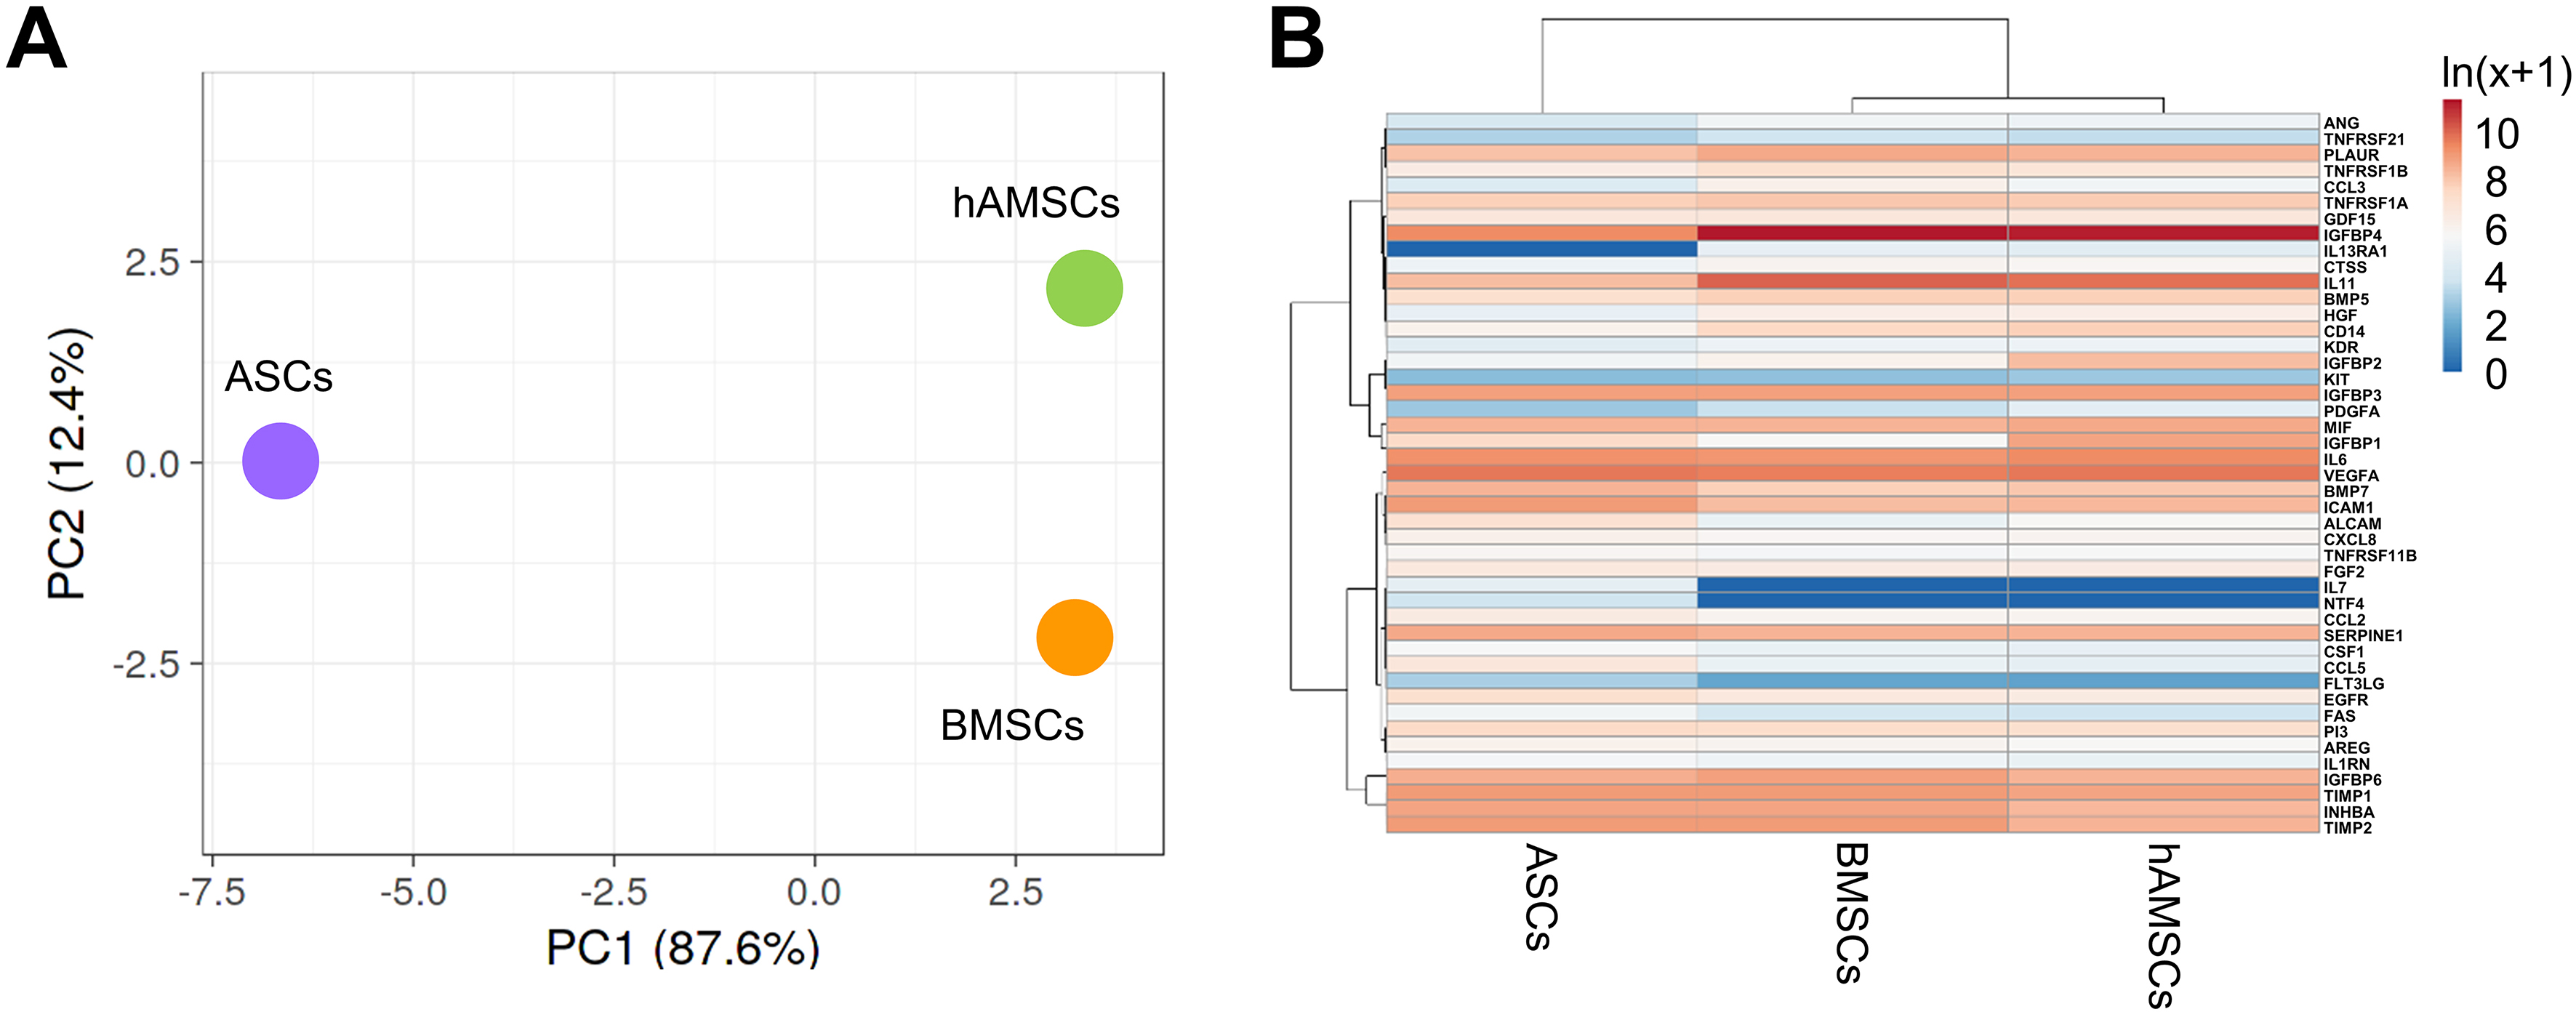
Figure 3. Secreted factor profile comparison between MSC types under study. (A) Principal component analysis of the ln(x+1)-transformed pg/ml MSC values of detected factors. The X and Y axes show Principal Component 1 and Principal Component 2, which explain 87.6% and 12.4% of the total variance, respectively; (B) Heat map of hierarchical clustering analysis of the ln(x+1)-transformed pg/mL MSCs values of detected factors with sample clustering tree at the top. Absolute expression levels reflect the color scale: red shades: high expression levels; blue shades: low expression levels. Data presented in PowerPoint. MSC: Mesenchymal stromal cell; hAMSCs: human amniotic mesenchymal stromal cells; BMSCs: bone marrow-derived mesenchymal stromal cells; ASCs: adipose-derived mesenchymal stromal cells; PCA: principal component analysis; PC1: principal component 1; PC2: principal component 2; ln: natural logarithm; VEGFA: vascular endothelial growth factor A; BMP7: bone morphogenetic protein 7; ALCAM: activated leukocyte cell adhesion molecule; IGFBP: insulin-like growth factor-binding protein; TIMP: tissue inhibitor of metalloproteinases; CTSS: cathepsin S; CSF1: colony-stimulating factor 1; NTF4: neurotrophin 4; SERPINE1: serpin family E member 1; AREG: amphiregulin.


