


fig5
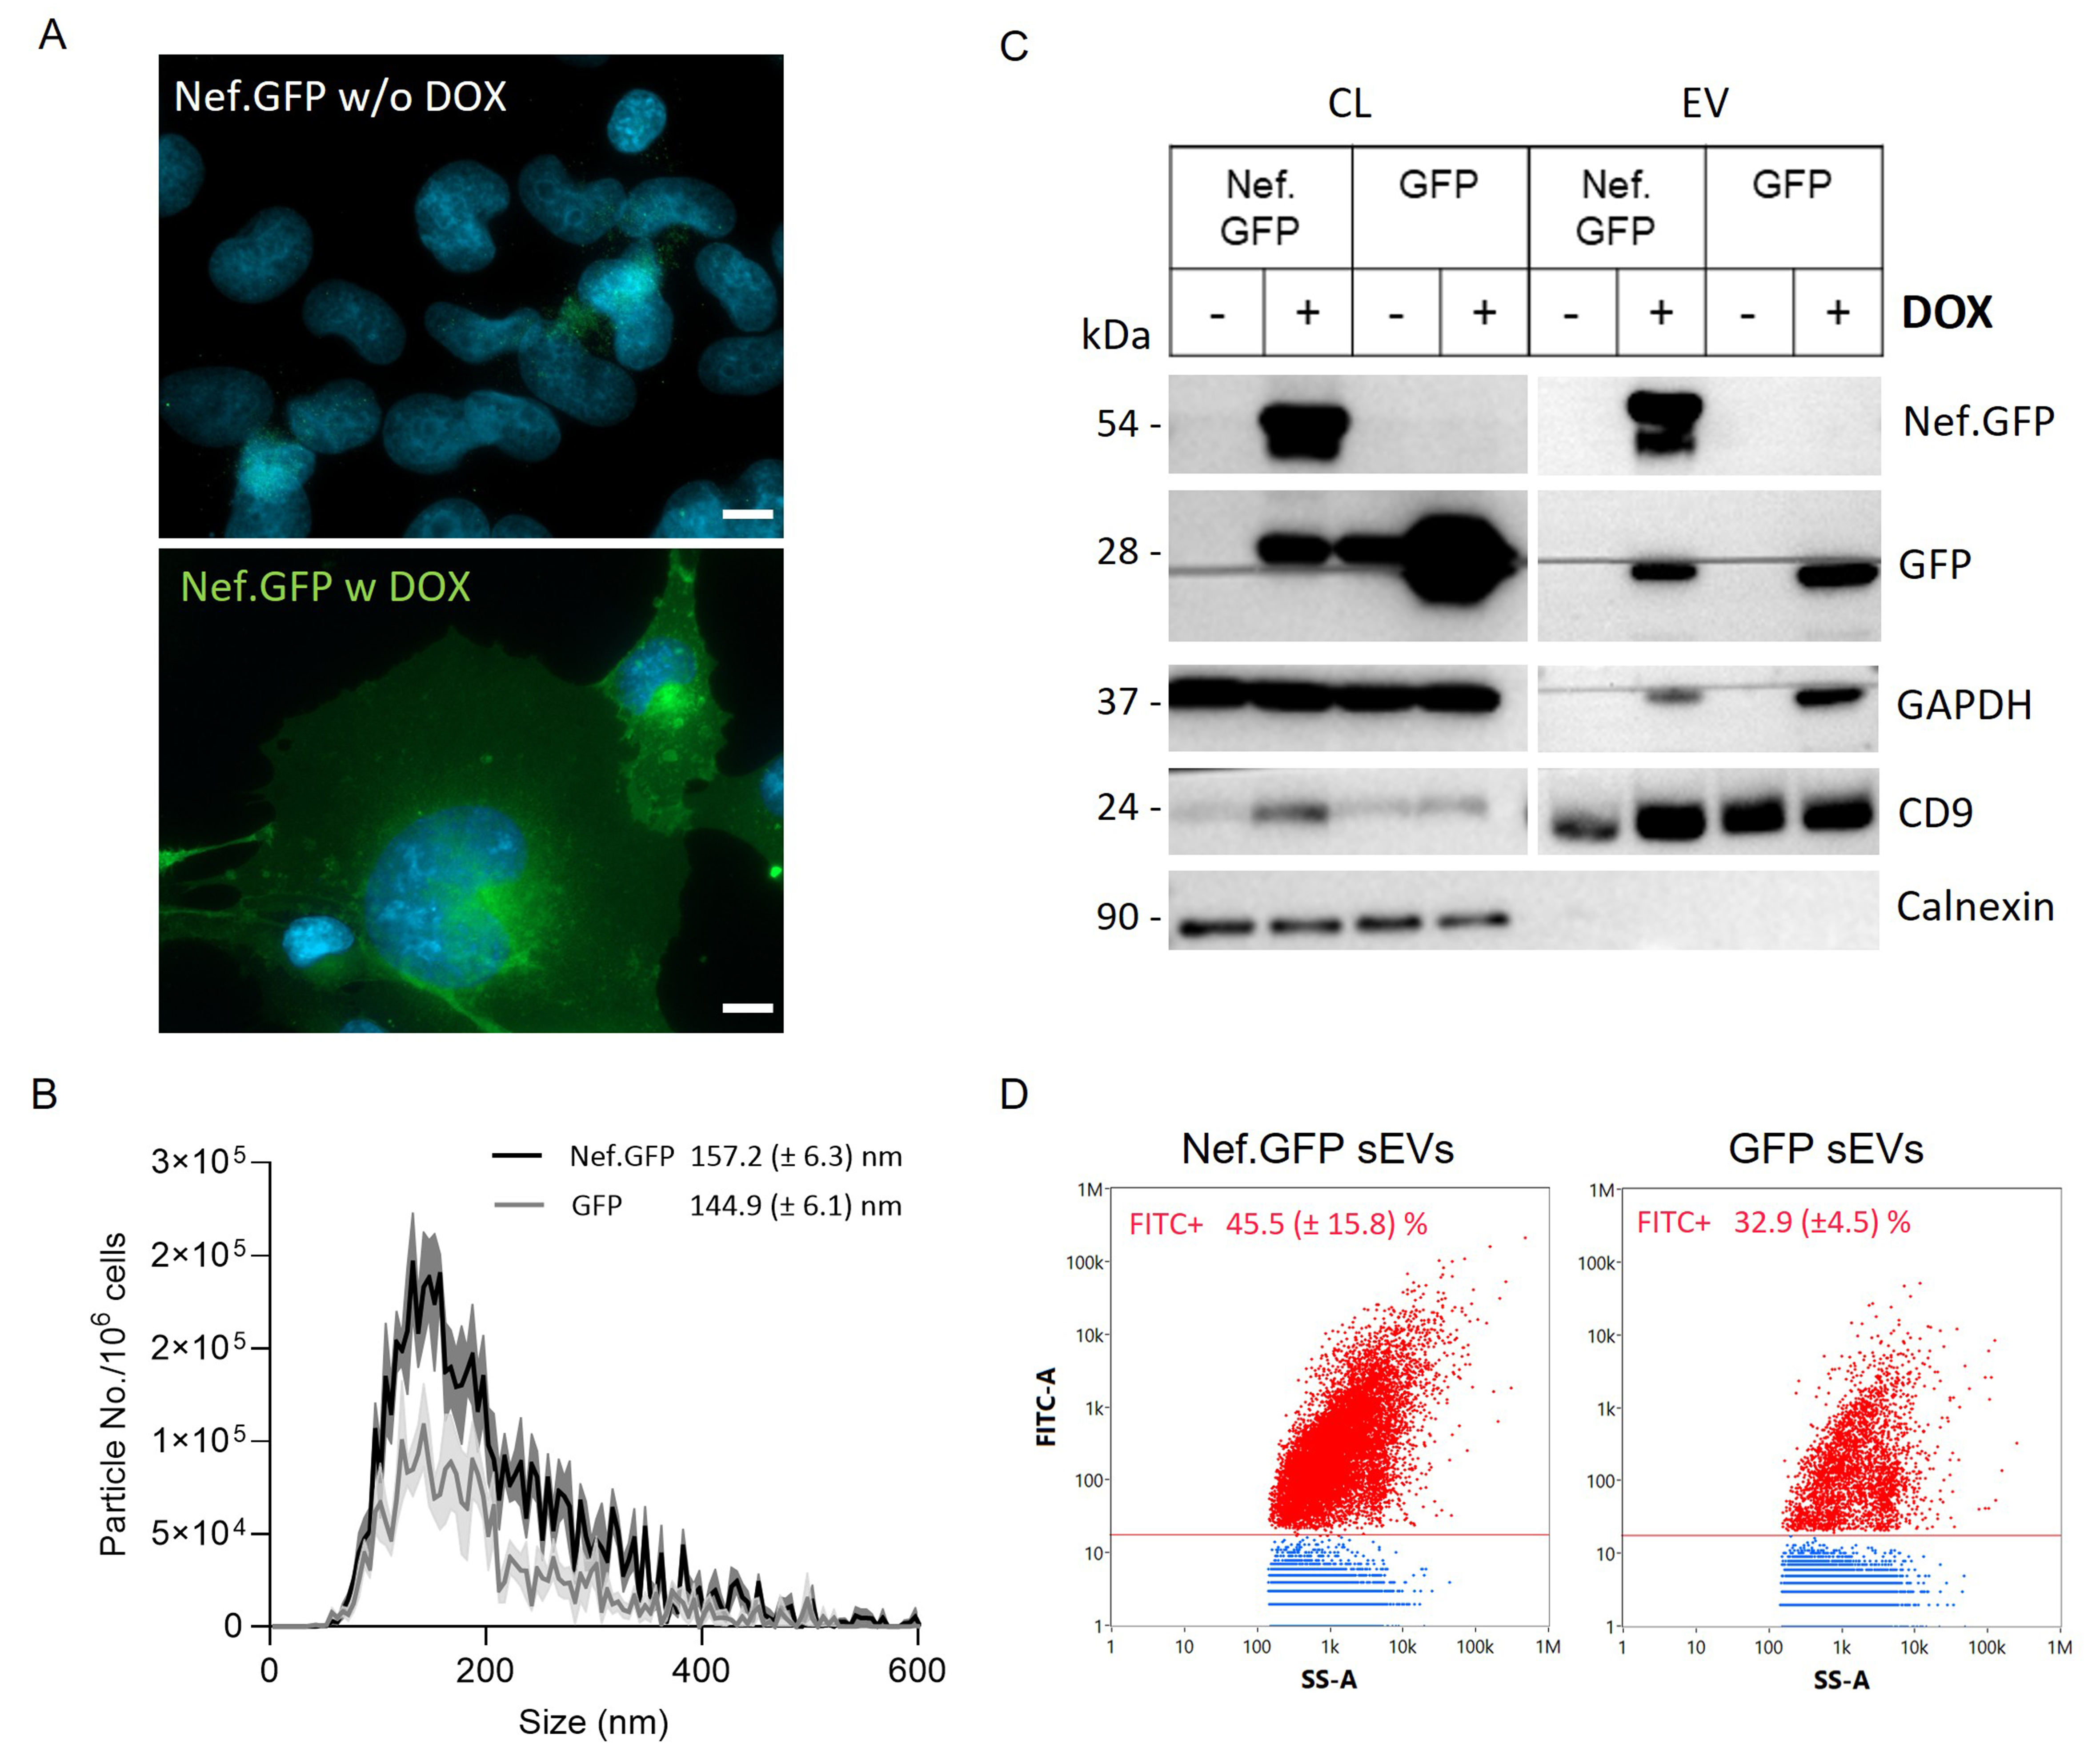
Figure 5. h-microglia harboring an inducible, stably integrated Nef.GFP transgene provide an improved cellular model for investigating Nef driven vesiculation. (A) Fluorescence microscopy of Nef.GFP expression in h-microglia with a stably integrated Nef.GFP transgene under an inducible promoter, without (w/o DOX) or with (w DOX) 50 ng/mL DOX treatment for 48 h. Nuclei are labelled with DAPI (blue). Scale bar: 10 μm (white); (B) Nanoparticle tracking analysis of small (crude) EVs enriched by ultracentrifugation, after removal of the 10,000 × g pellet from the media of Nef.GFP (black) and GFP (gray) expressing h-microglia cultures. The distribution curve represents the frequency (particles per million cells) in relation to particle mode size (2r, nm); (C) Immunoblot analysis of small (crude) EVs enriched from the media of Nef.GFP and GFP expressing (+ DOX) or not (- DOX) h-microglia cultures, with antibodies directed against Nef, GFP, typical EV proteins (GAPDH, CD9) and EV impurity marker Calnexin; (D) Representative dot plots of small (crude) EVs enriched from Nef.GFP and GFP expressing cultures, displaying FITC fluorescence (FITC-A) in relation to side scatter (SS-A) after analysis with nano-flow cytometry. The EV sample enriched from LV-control h-microglia culture was used to gate fluorescent EVs. Nef.GFP+ or GFP+ EVs are indicated in red, while non-fluorescent particles are indicated in blue. Respective percentages of fluorescent particles (FITC+) from three independent experiments (± SD) are indicated in the graph. EV: Extracellular vesicles; CL: cell lysate; Nef.GFP: Nef green fluorescent protein; h-microglia: human microglia; DOX: doxycycline; DAPI: 4’,6-diamidino-2-phenylindole; GAPDH: glyceraldehyde 3-phosphate dehydrogenase; CD9: cluster of differentiation 9; FITC: fluorescein isothiocyanate; SS-A: side scatter; LV: lentiviral; Calnexin: calnexin protein; GFP: green fluorescent protein.


