

fig6
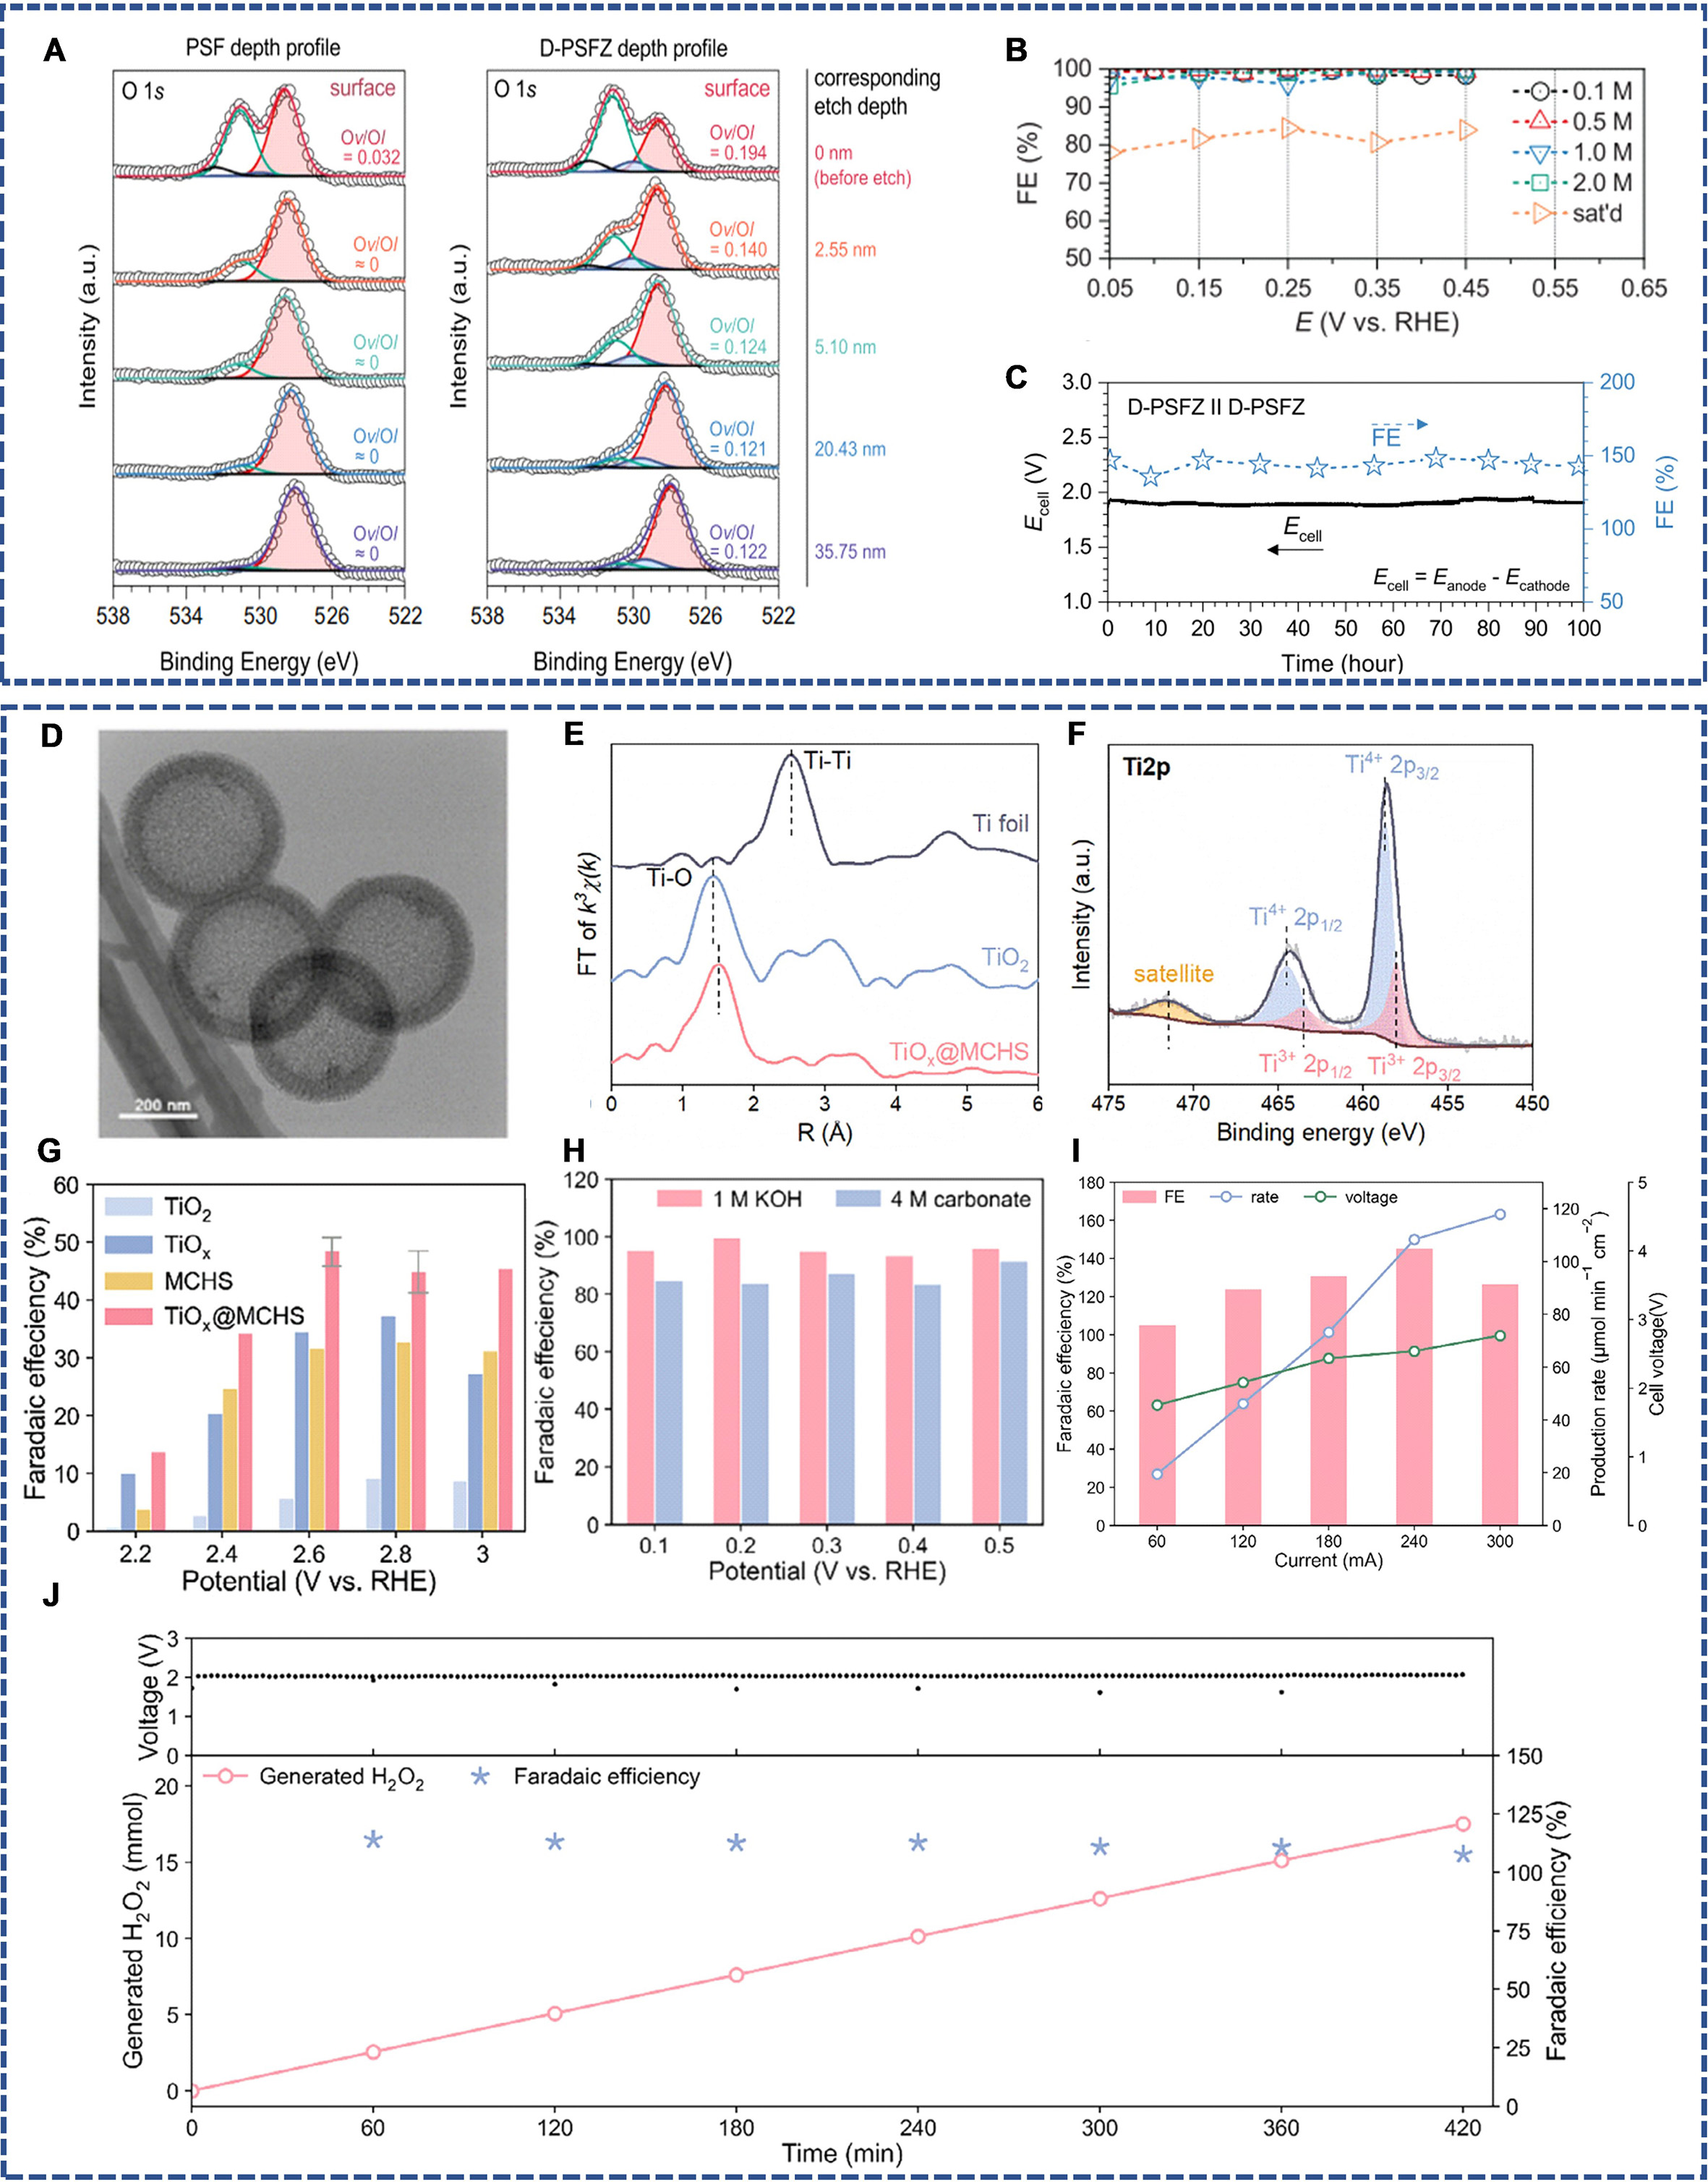
Figure 6. Symmetric catalytic electrode pairs for the concerted H2O2 production: (A) XPS depth profile analysis in the O 1s region for PSF and D-PSFZ and the corresponding Ov/Ol ratio upon the depth as the footnote; (B) 2e- ORR FE of D-PSFZ at the various solution concentrations of 0.1 to 2.0 M and saturated KHCO3 solution; (C) The stability profile for D-PSFZ||D-PSFZ Ecell measured in O2 saturated 2.0 M KHCO3/K2CO3 at 50 mA cm-2; (A-C) are adapted with permission from[25]. Copyright © 2023 Springer Nature. (D) The TEM image of TiOx@MCHS; (E) Fourier transform Ti K-edge EXAFS profiles of TiOx@MCHS, Ti foil, and TiO2; (F) The XPS Ti 2p spectra of TiOx@MCHS; (G) The FE of H2O2 for 2e- WOR over different catalysts as a function of potential tested in 1 M Na2CO3; (H) The FE of 2e- ORR for H2O2 on TiOx@MCHS at different potentials performed in a 1 M KOH or 3.5 M K2CO3 + 0.5 M KHCO3 solution; (I) The H2O2 FE, generation rates and the total voltages of the 2e- WOR//2e- ORR cell at constant currents; (J) The FE, generation amounts of H2O2 and the cell voltages during long-term stability test at 120 mA (anode current density: 120 mA cm-2); (D-J) are adapted with permission from[123]. Copyright © 2025 Wiley-VCH GmbH.





