


fig6
From: Heteroatom-driven the rapid electrochemical process of anthracite derivatives in sodium-ion battery
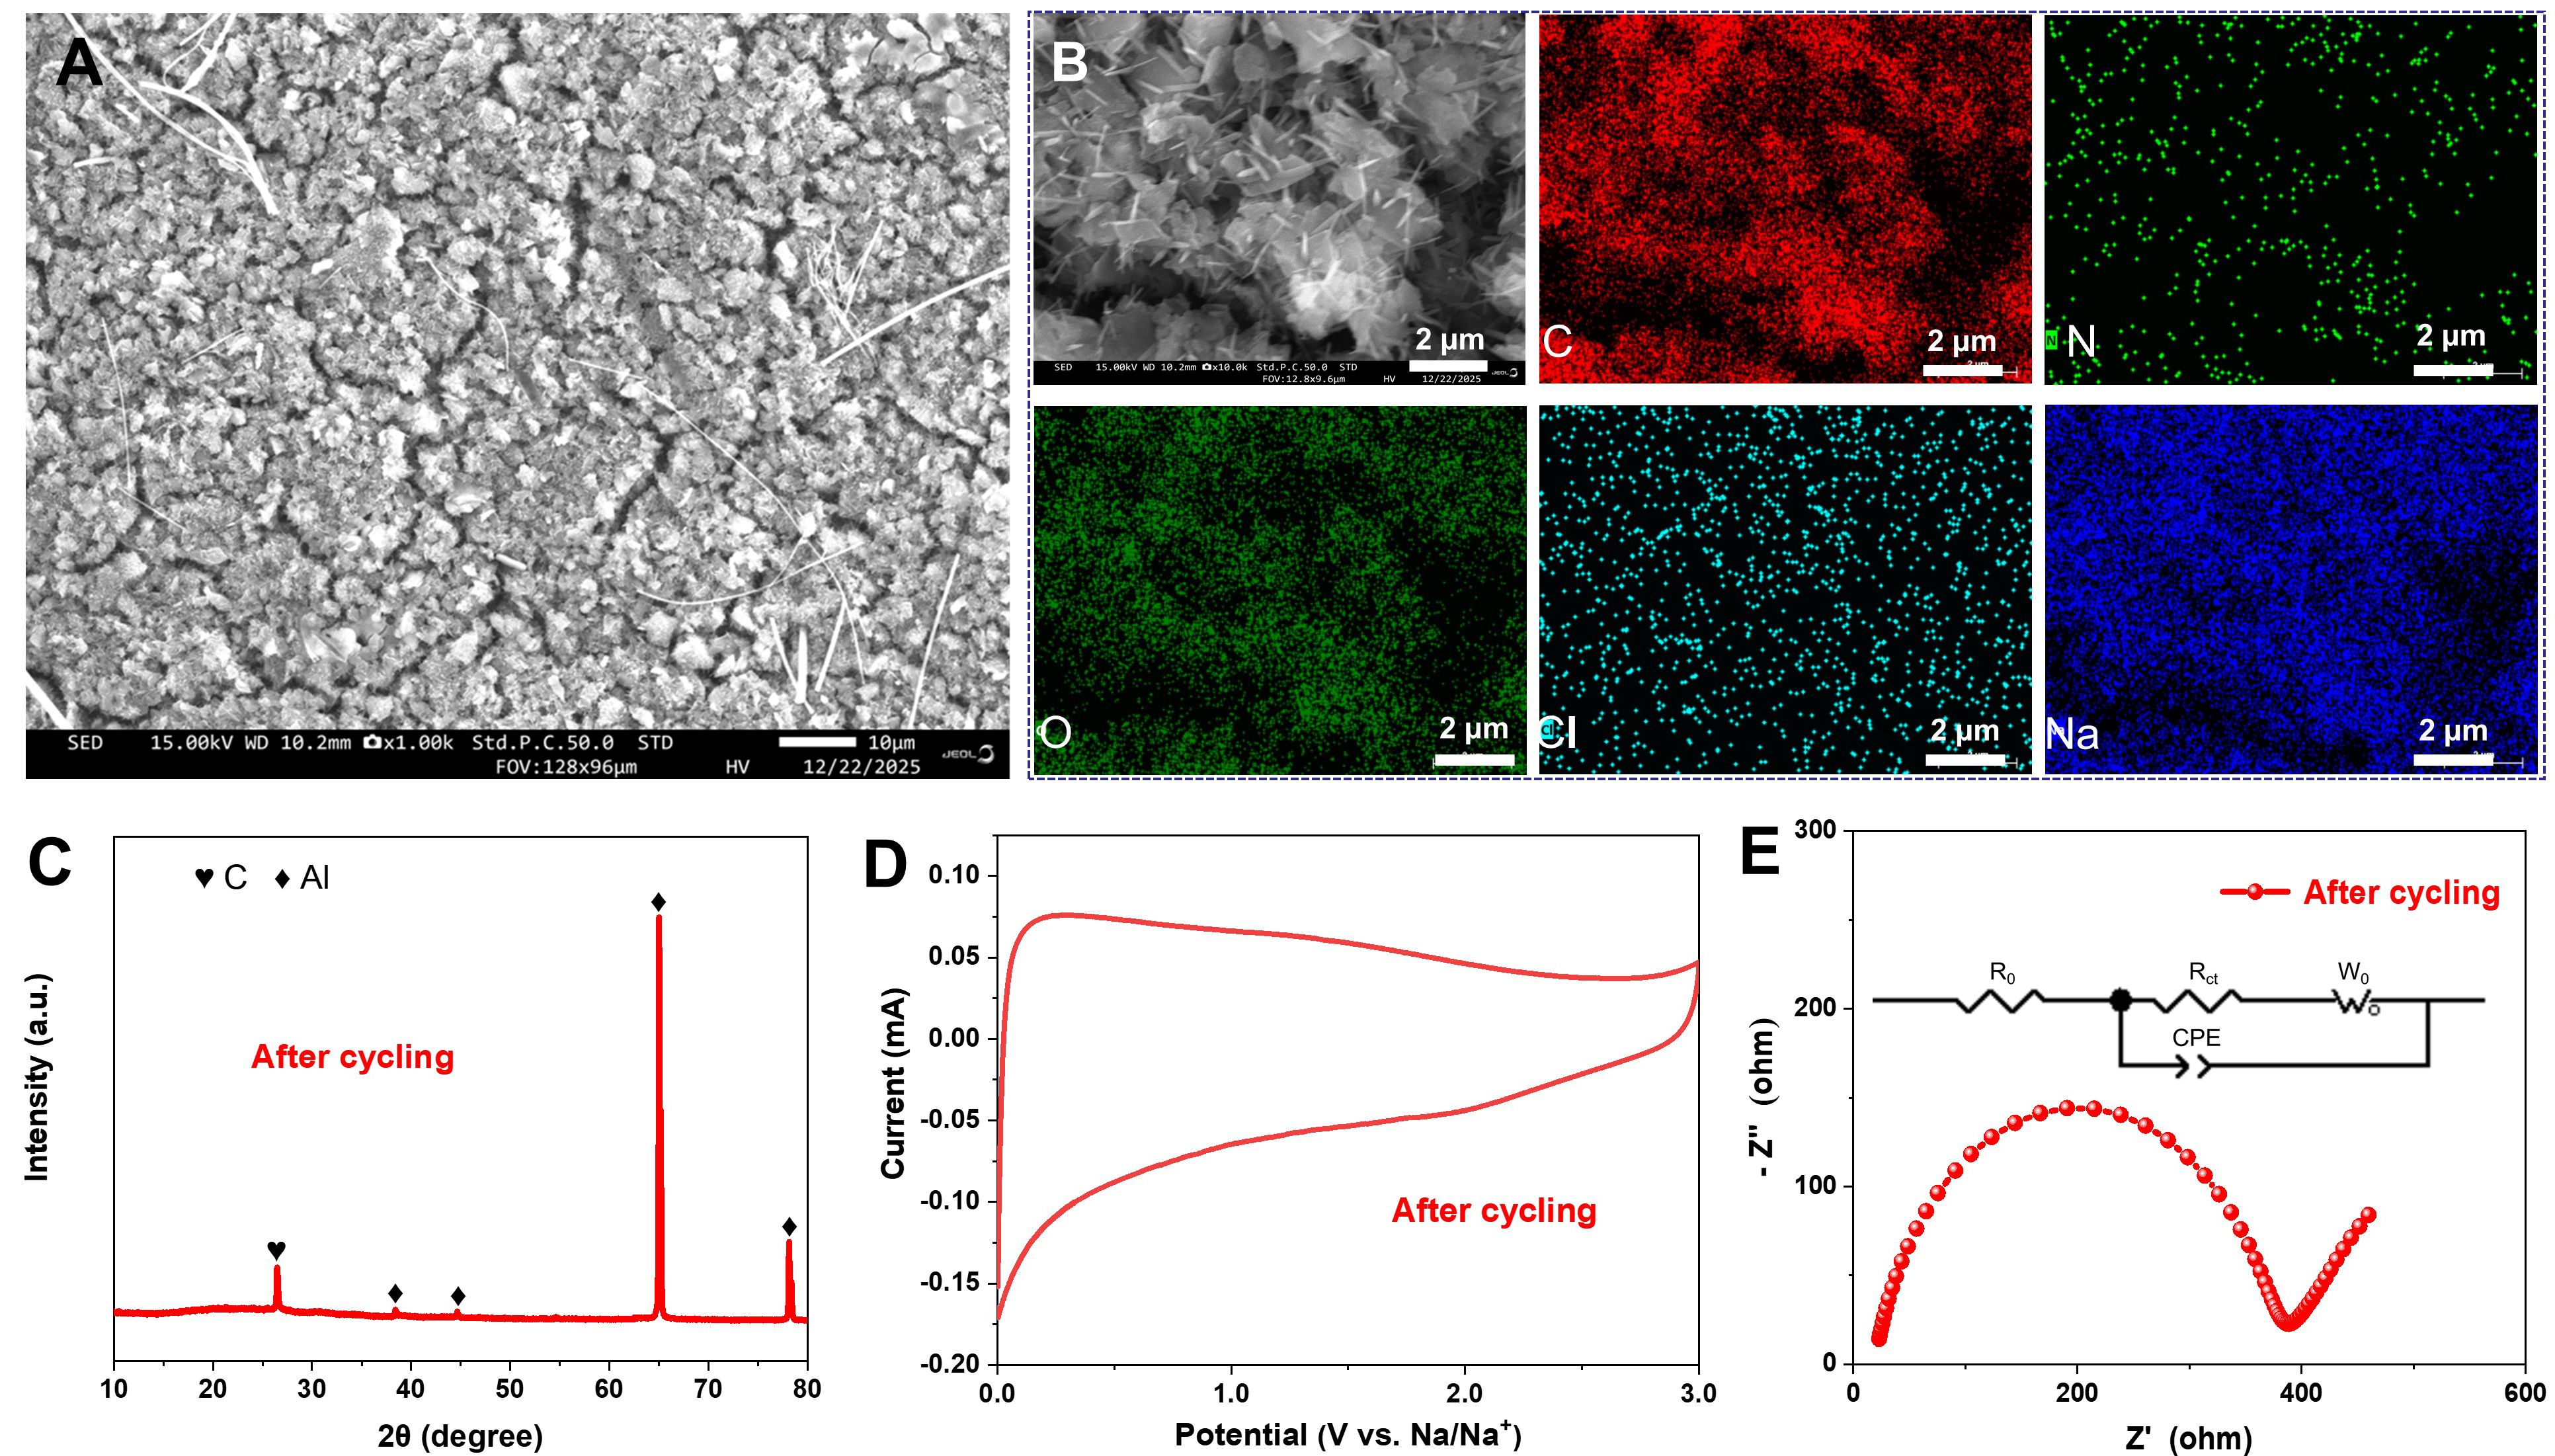
Figure 6. (A) SEM; (B) EDS mapping images; (C) XRD; (D) CV curve and (E) EIS spectrum of ACp-N-Cl after cycling upon discharging to 0.01 V. SEM: Scanning electron microscopy; EDS: XRD: X-ray diffraction; CV: cyclic voltammetry; EIS: electrochemical impedance spectroscopy.


