


fig9
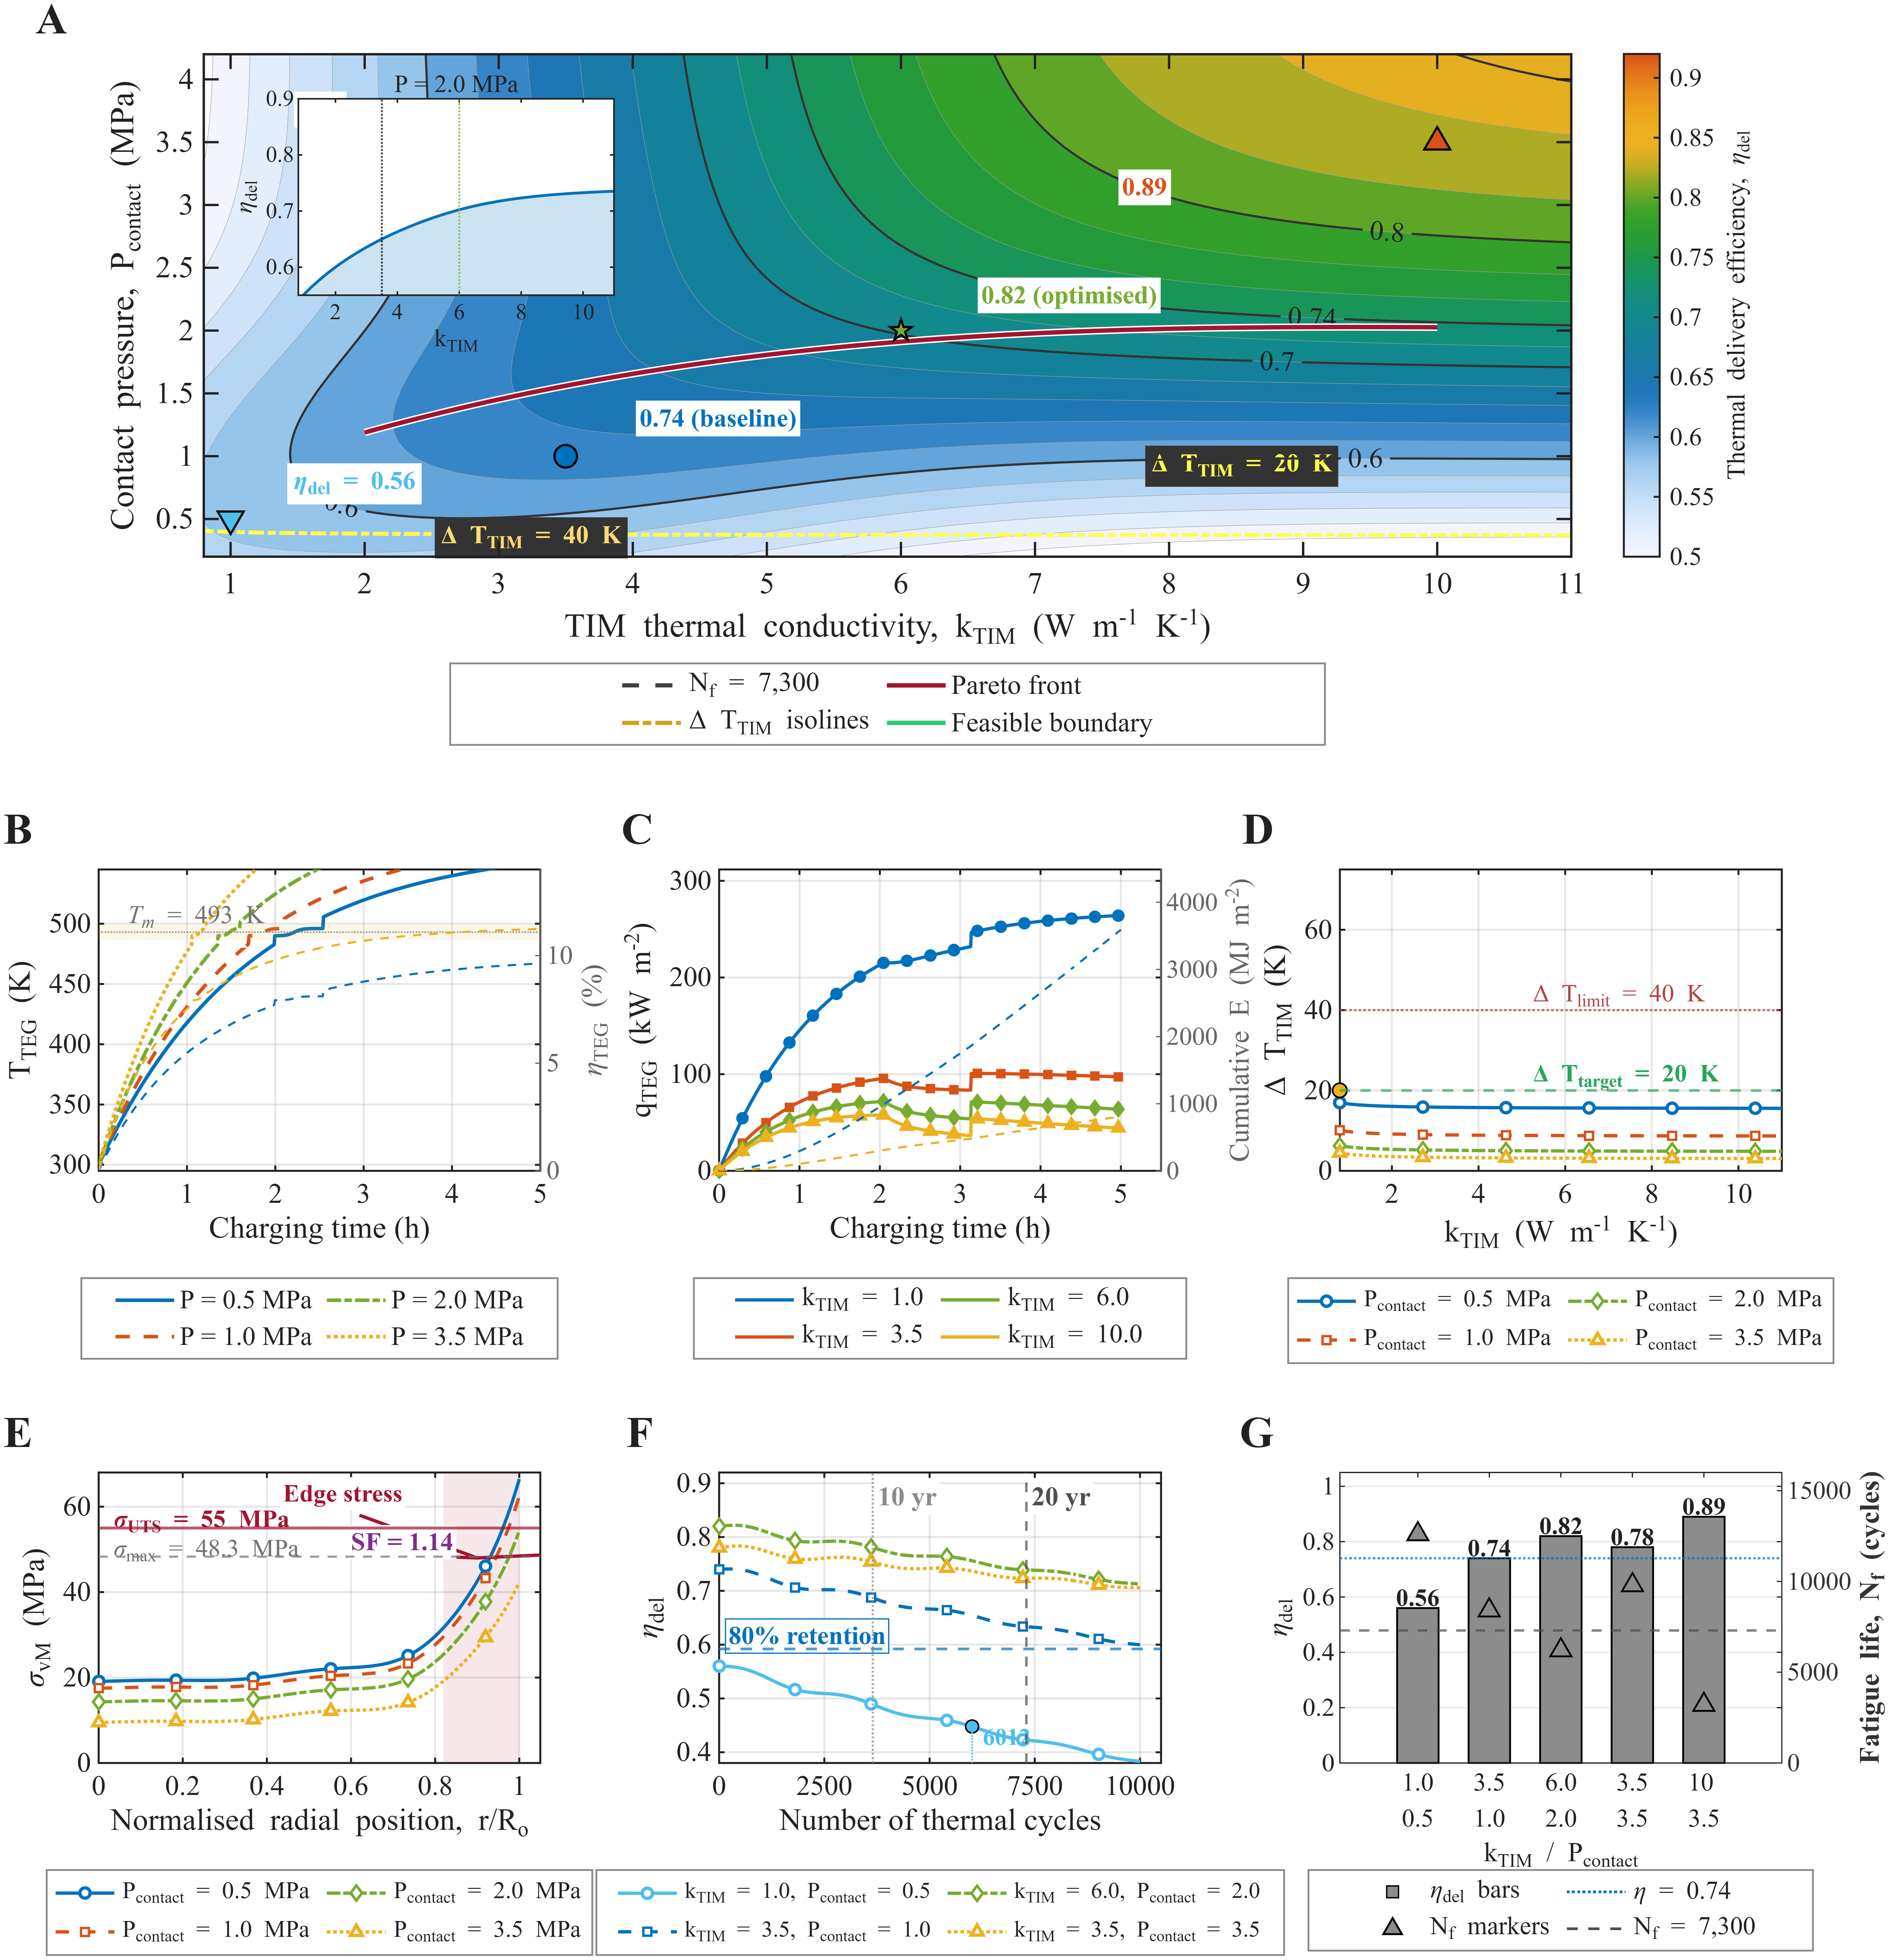
Figure 9. Parametric analysis of interfacial thermal performance and thermo-mechanical reliability. (A) Coupled effects of thermal conductivity and contact pressure on thermal delivery efficiency; (B) TEG-side temperature and instantaneous conversion efficiency under different contact pressures. Solid curves denote TTEG on the left axis, and dashed curves denote ηTEG on the right axis; the blue and yellow dashed curves correspond to Pcontact = 0.5 and 3.5 MPa, respectively; (C) Heat flux and cumulative delivered thermal energy under different TIM conductivities. Solid curves denote qTEG on the left axis, and dashed curves denote cumulative delivered thermal energy on the right axis; the blue and yellow dashed curves correspond to kTIM = 1.0 W m-1 K-1 and 10.0 W m-1 K-1, respectively; (D) Interfacial temperature drops as a function of TIM conductivity and contact pressure; (E) Radial stress distribution indicating edge stress concentration; (F and G) Cyclic degradation trajectories and comprehensive comparison balancing thermal efficiency and fatigue life. Panel (G) identifies the design point at kTIM = 6.0 W m-1 K-1 and Pcontact = 2.0 MPa as providing the optimal balance between thermal delivery efficiency and projected service life. TEG: Thermoelectric generator; TIM: thermal interface material.


