

fig2
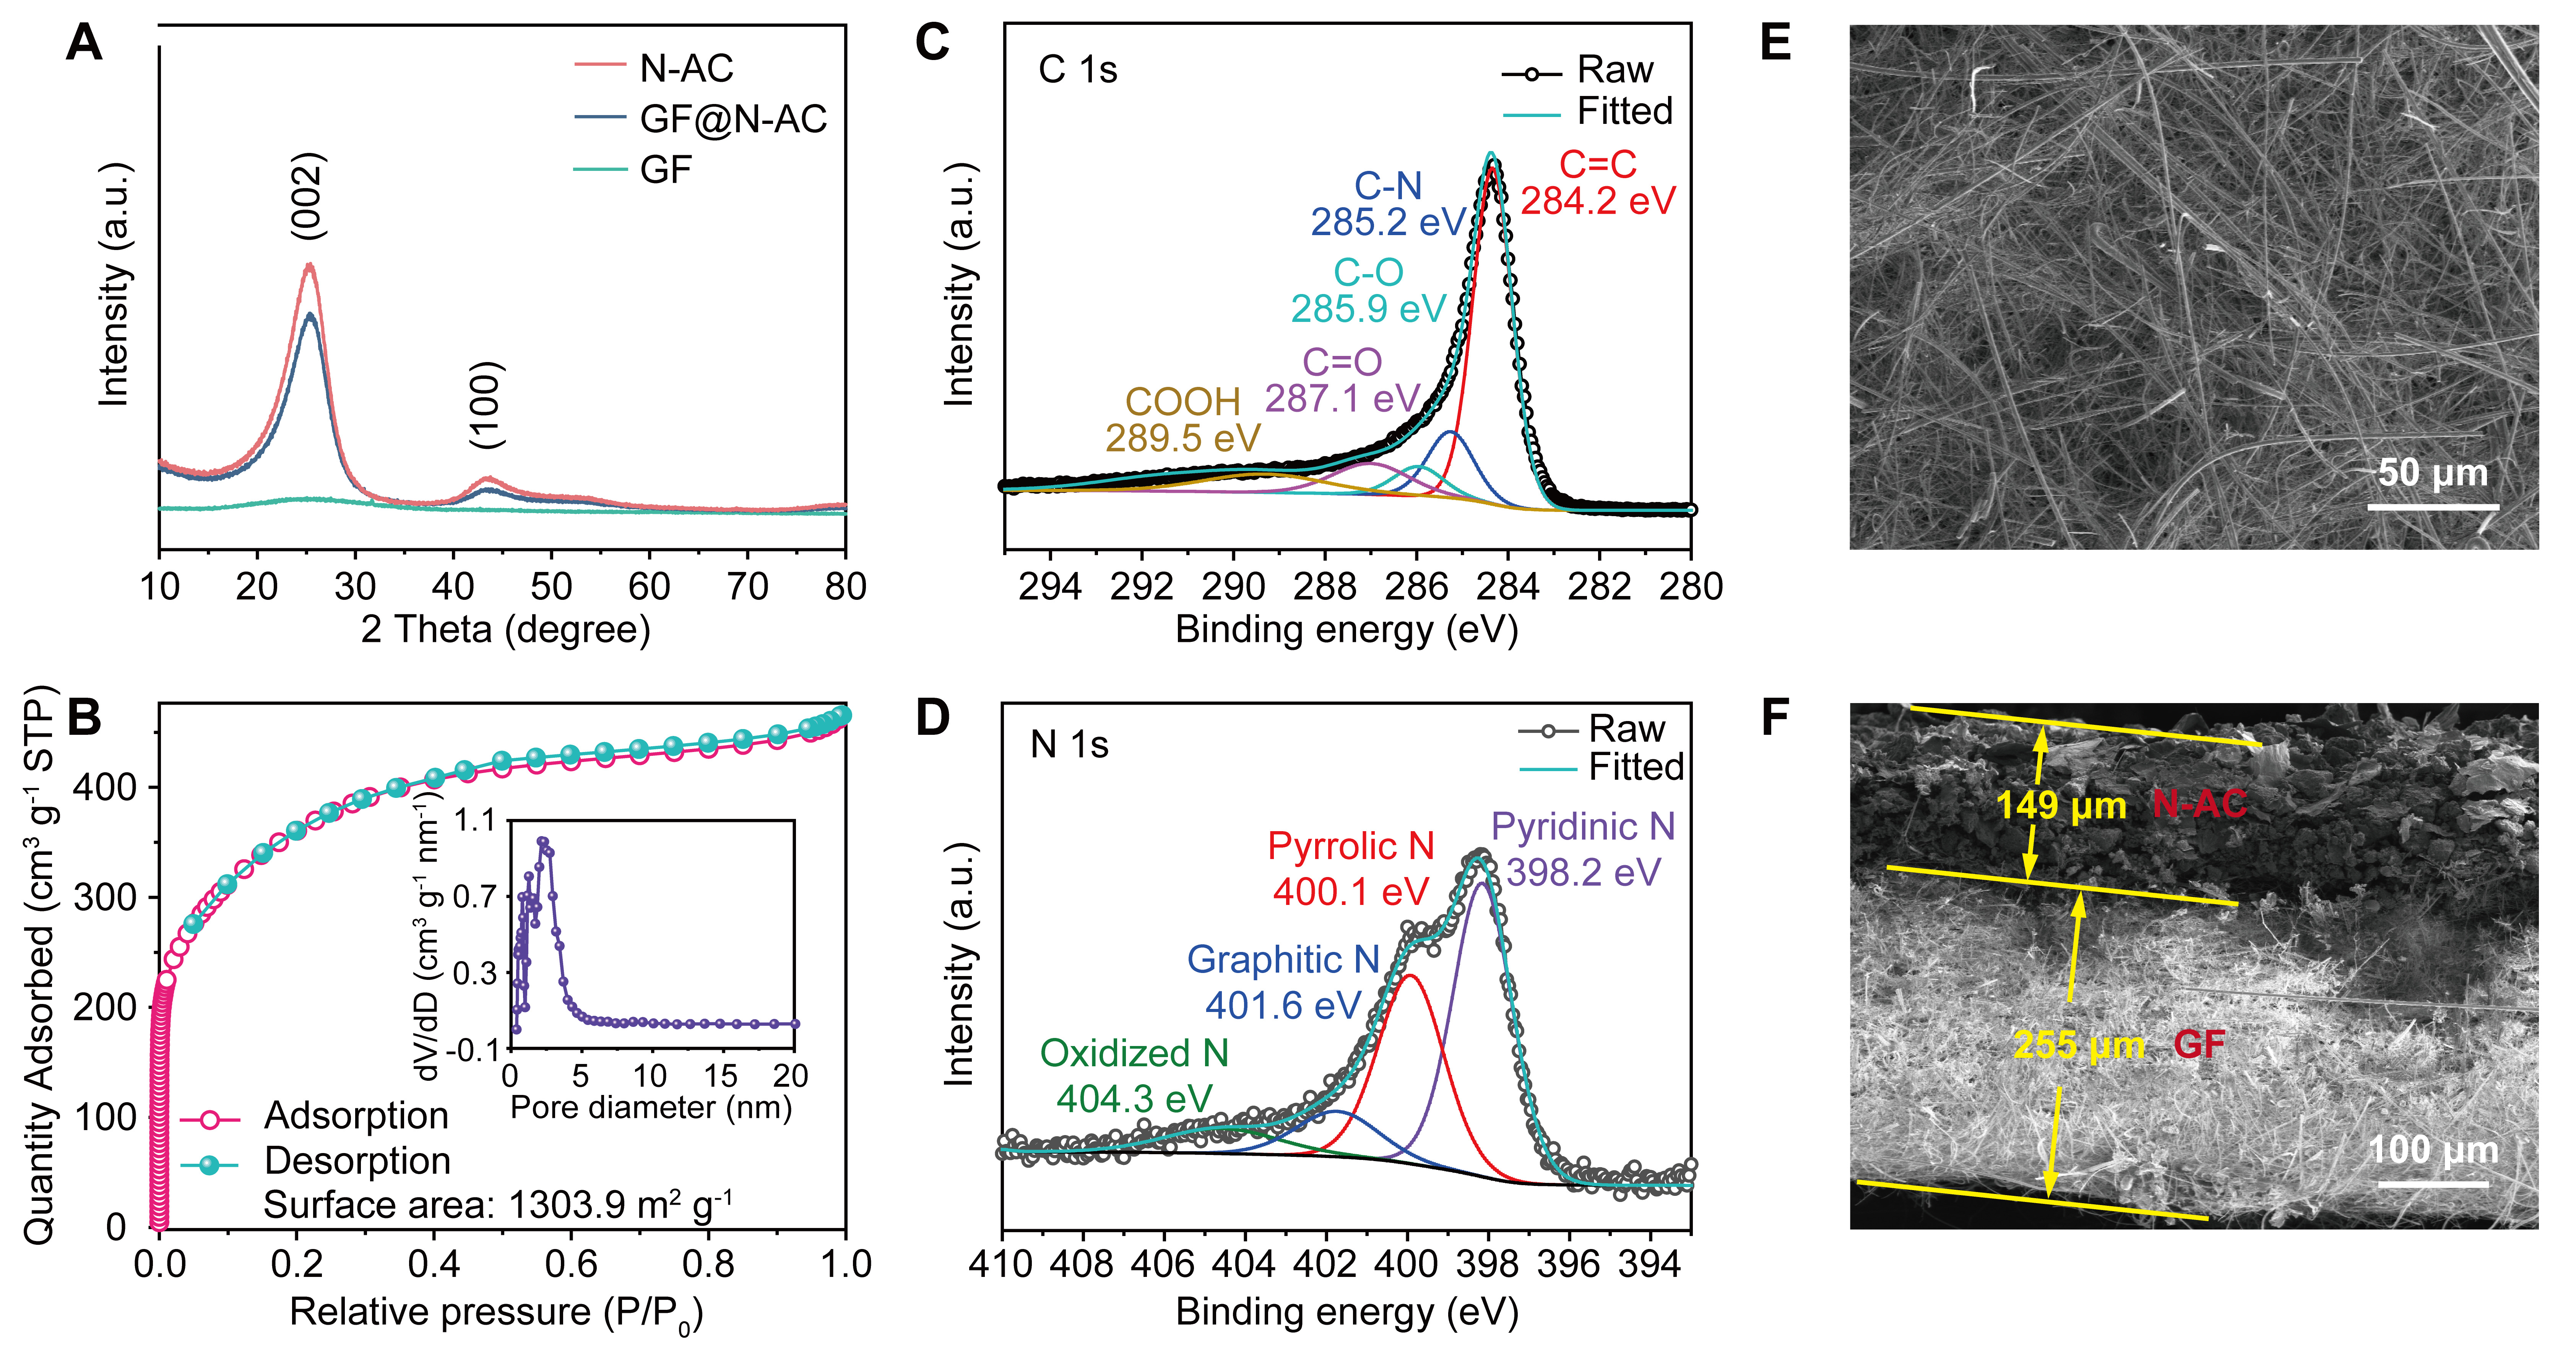
Figure 2. Derivation and characterization of N-AC and functionalized glassfiber separators (GF@N-AC). (A) XRD patterns of N-AC, GF@N-AC and GF; (B) Nitrogen adsorption/desorption curves of N-AC sample [the inset shows the pore distribution calculated by Barret-Joyner-Halenda (BJH) model]; Deconvolution of high-resolution XPS spectra for C 1s (C) and N 1s (D) of N-AC; (E and F) SEM images of the bare GF separator (E) and cross-sectional image of the functionalized separator (F). XRD: X-ray diffraction; N-AC: nitrogen-doped activated carbon; GF: glass fiber; XPS: X-ray photoelectron spectroscopy; SEM: scanning electron microscopy; STP: standard temperature and pressure.





