


fig7
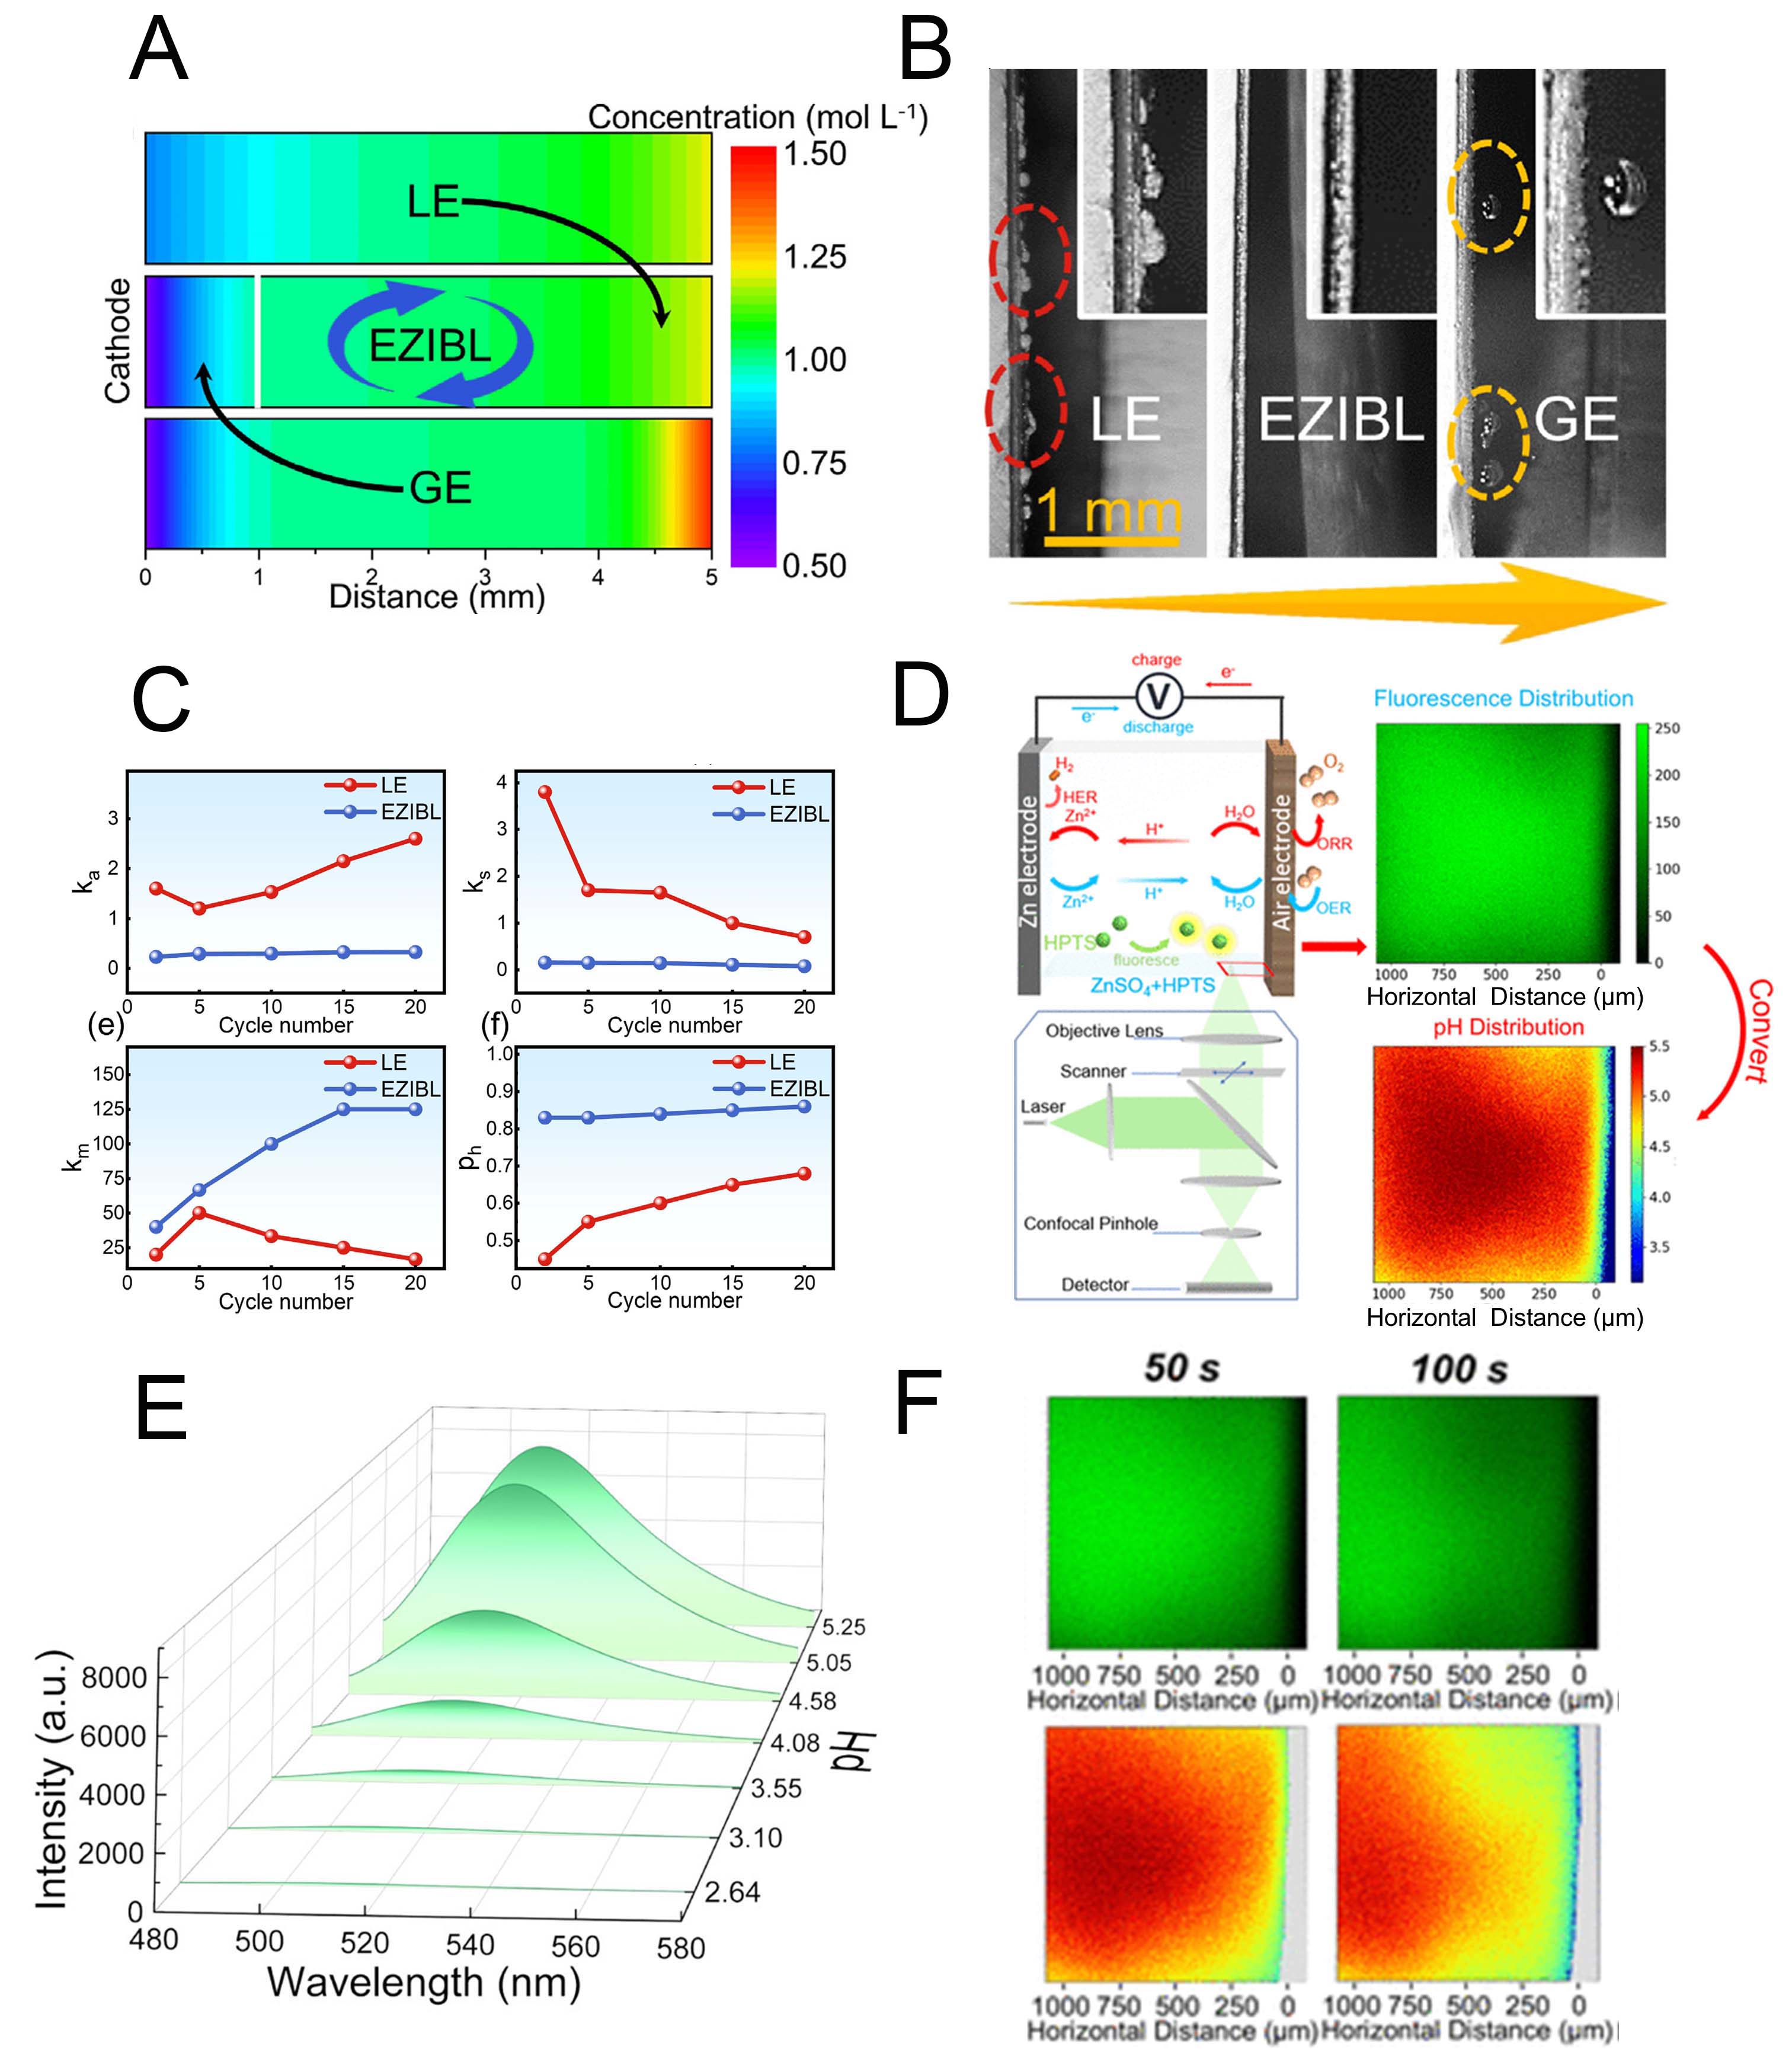
Figure 7. (A) The concentration distribution cloud map of Zn2+ in different electrolytes at 5 mA cm-2 via numerical simulations[105]. (B) Macroscopic optical observation photographs at 5 mA cm-2 and 2 mAh cm-2 in different electrolytes[105]. (C) Variation curves of four important parameters (ka, ks, km, and ph)[105]. (A-C) Reproduced with permission from[105]. Copyright 2024, KeAi Publishing. (D) Schematic diagram of the observation mechanism using laser scanning confocal microscopy[108]. (E) Fluorescence emission spectra of 1 M ZnSO4 with 500 μM HPTS in the pH range of 2.64 to 5.25[108]. (F) The pH distribution around the air electrode charging at 0.05 mA cm-2 obtained by CLSM[108]. (D-F) Reproduced with permission from[108]. Copyright 2024, American Chemical Society.


