
fig4
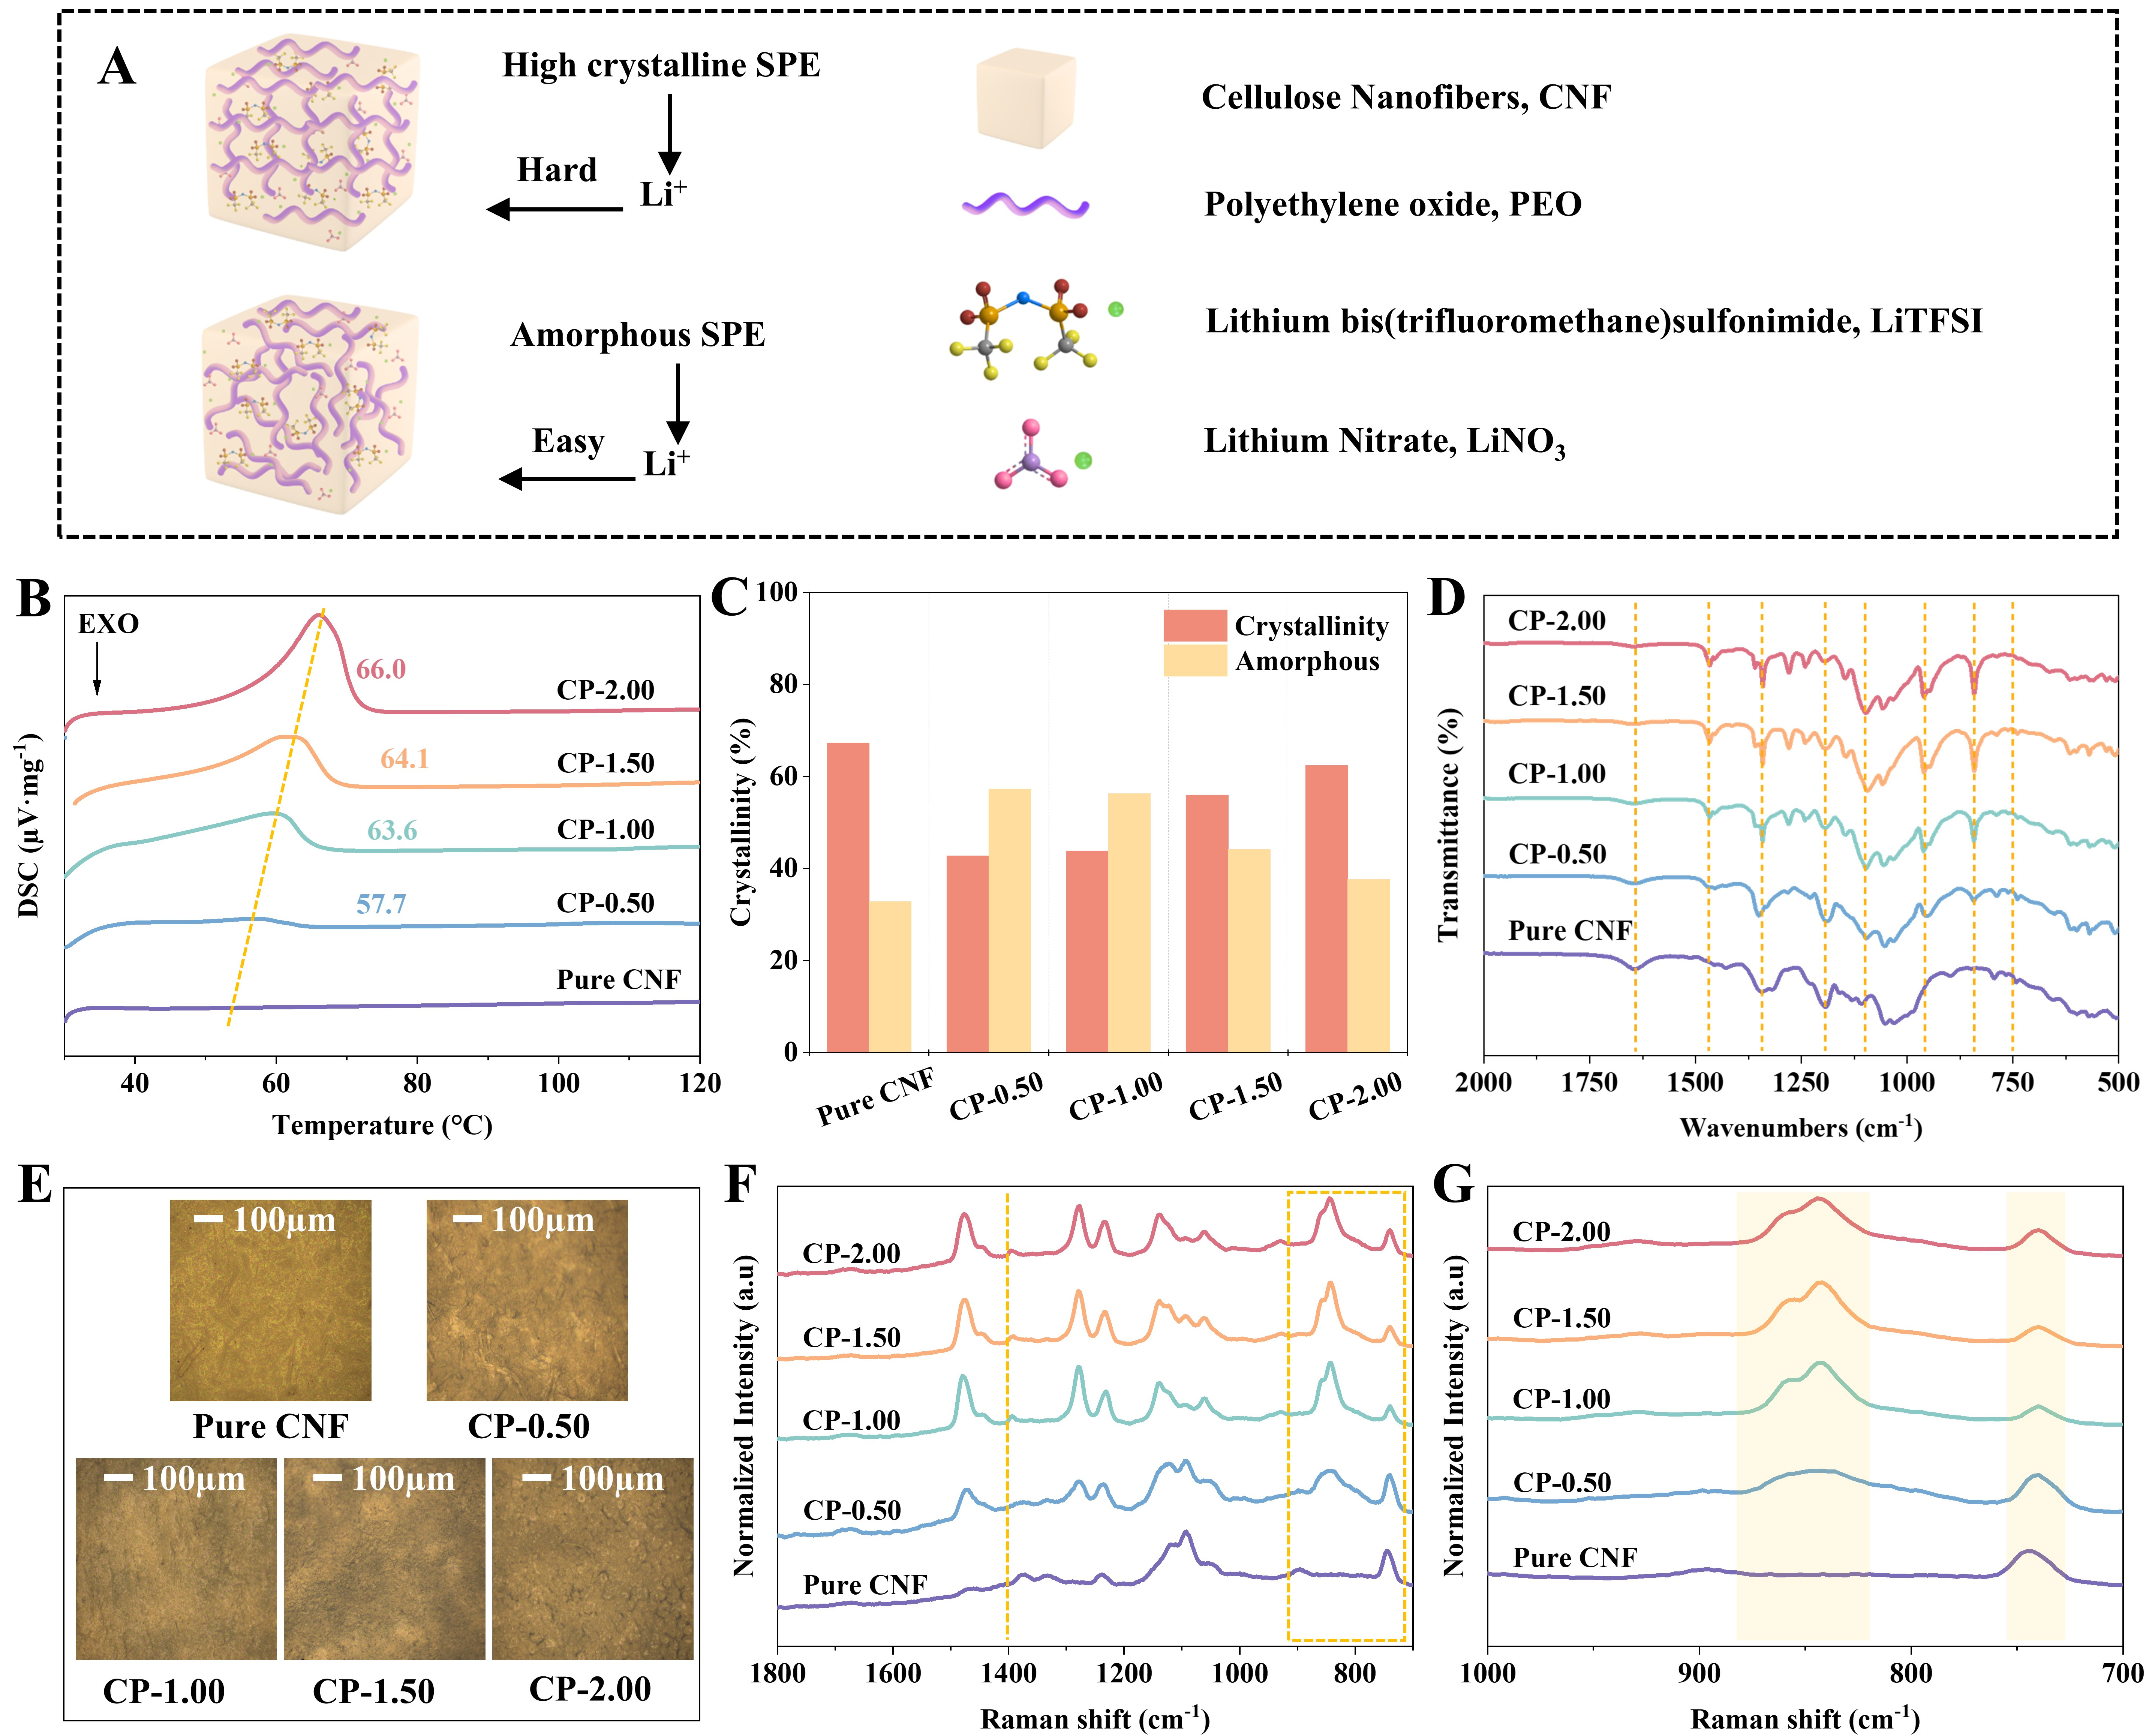
Figure 4. (A) Schematic illustration of the quasi-SPE interface and Li+ diffusion paths; (B) Differential scanning calorimetry; (C) The % crystallinity of samples; (D) FT-IR spectra; (E) Optical photographs at 10× magnification; (F-G) Raman spectra in the 1,800-700 cm-1 and 1,000-700 cm-1 regions, respectively. SPE: Solid polymer electrolyte; FT-IR: Fourier-transform infrared spectroscopy.