
fig4
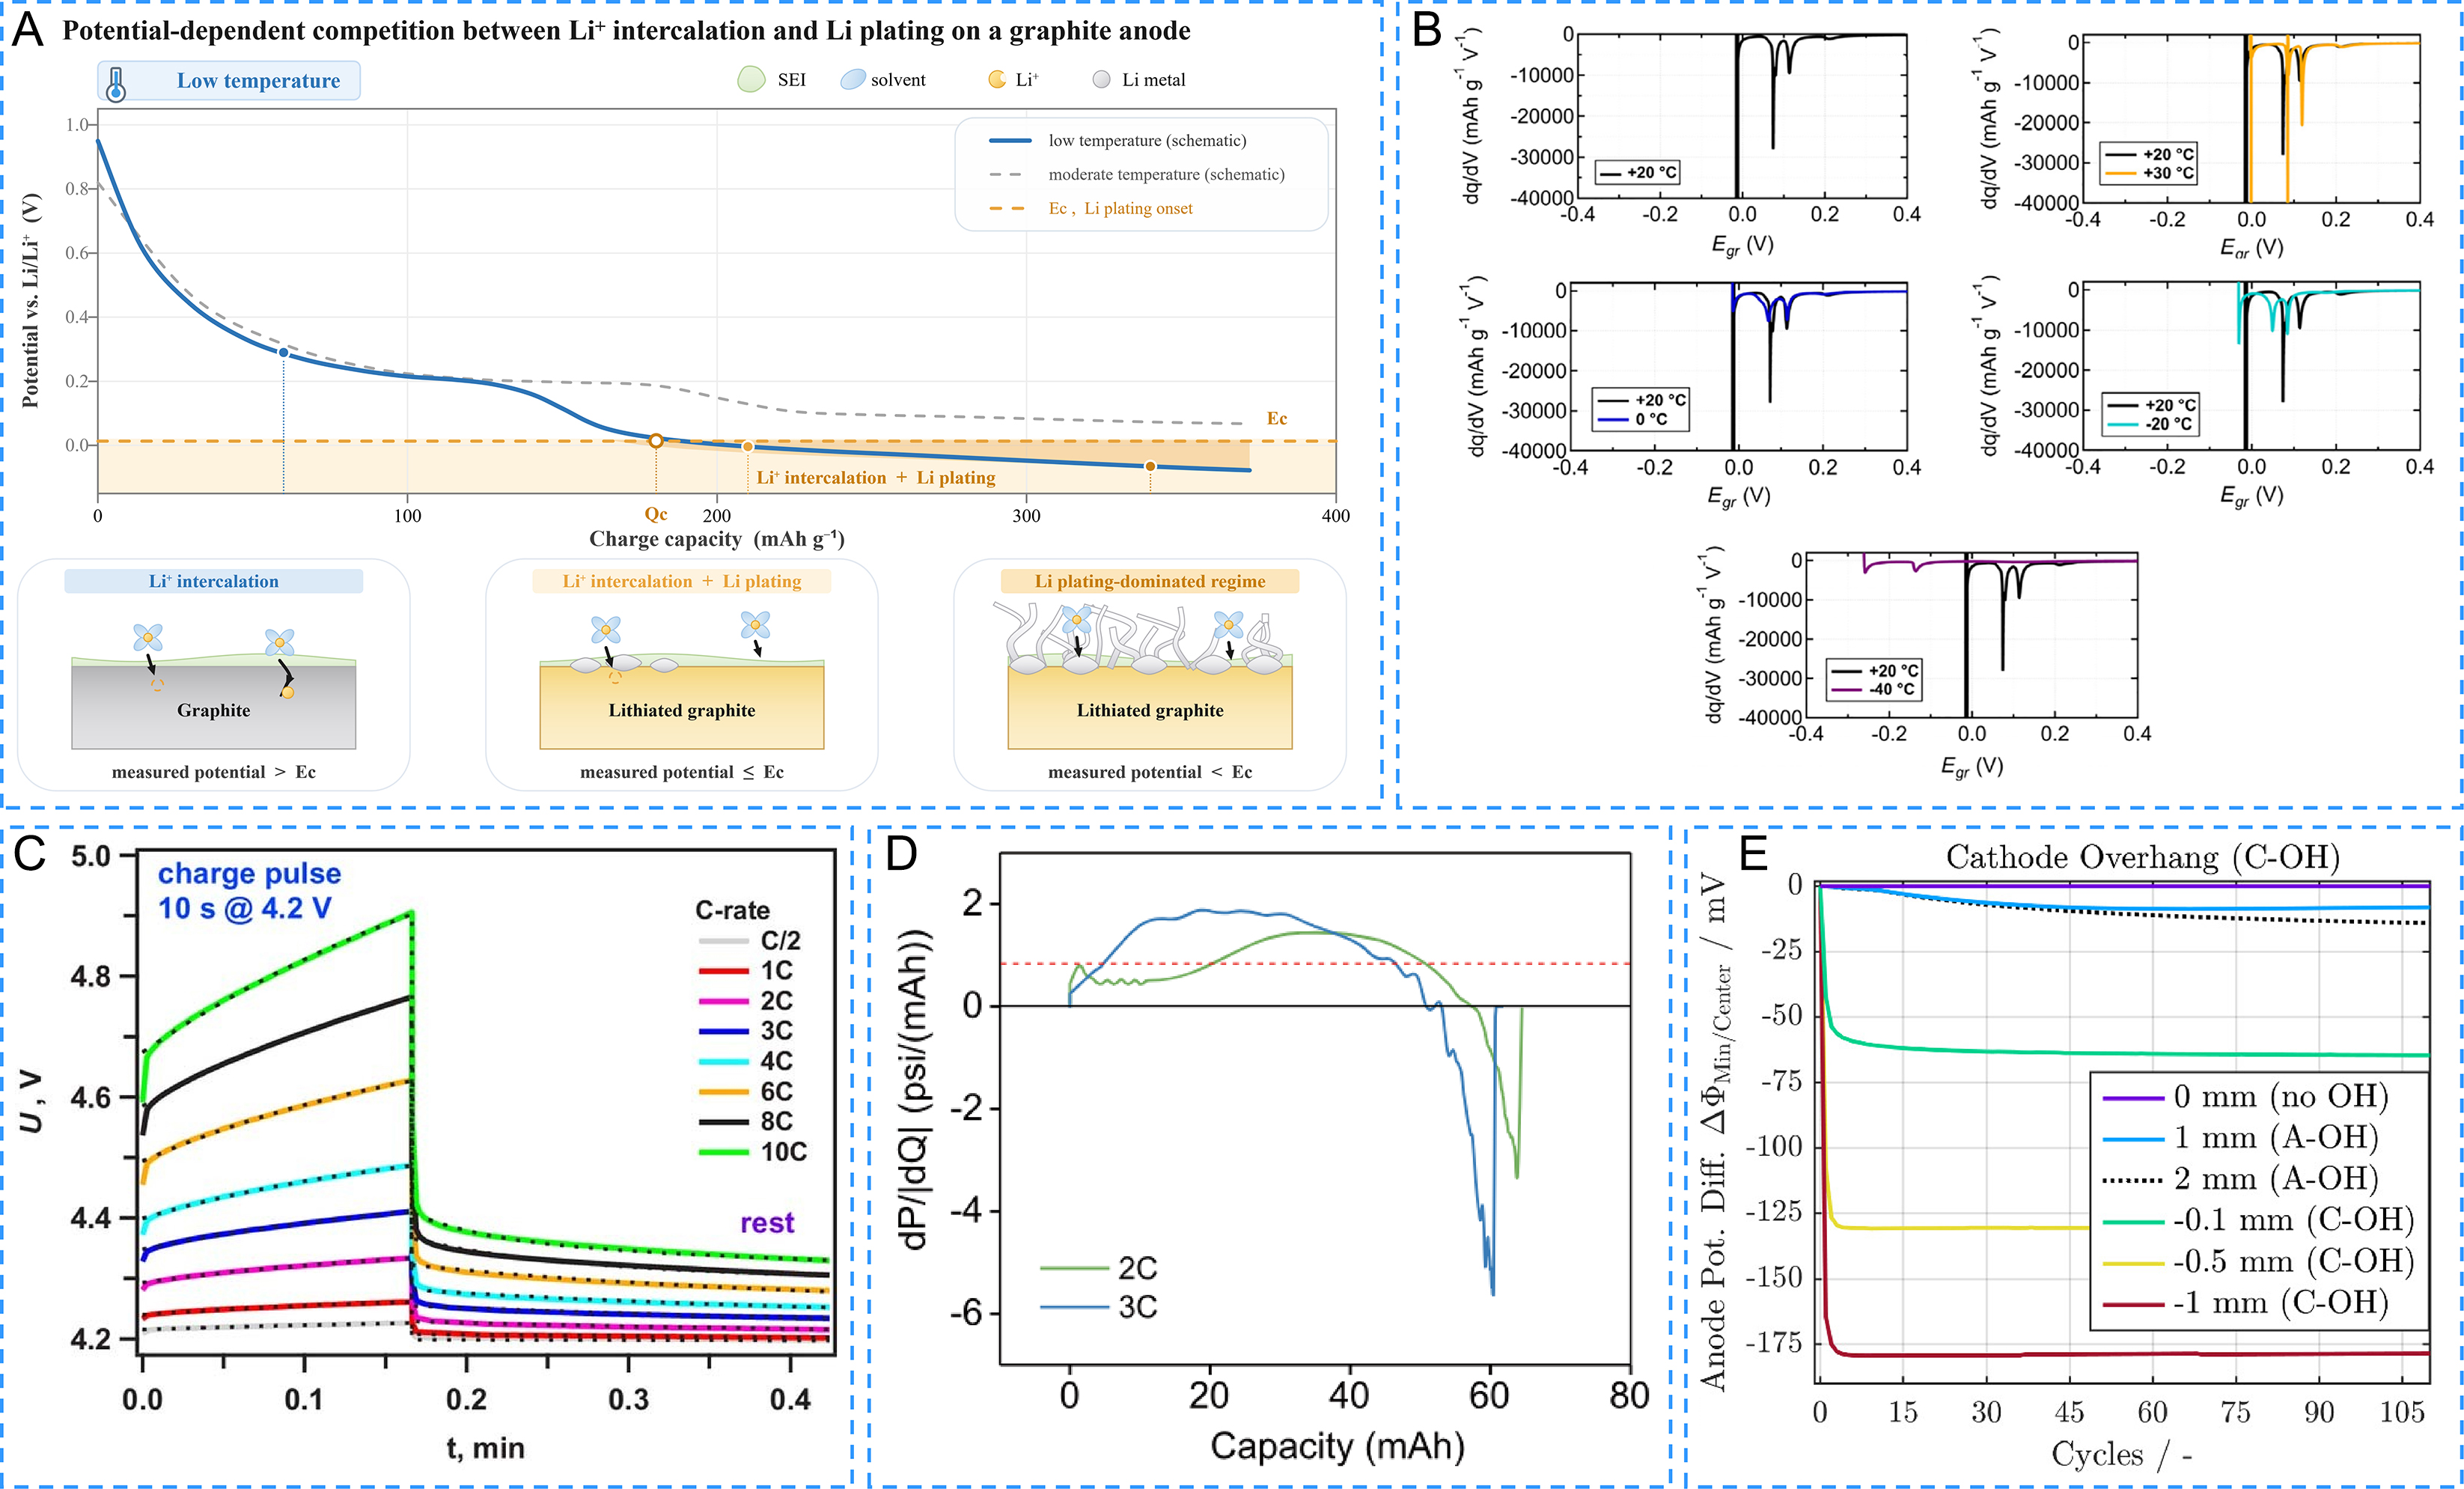
Figure 4. (A) Schematic illustration of the potential dependent competition between Li+ intercalation and lithium plating on a graphite anode during galvanostatic charging of a lithium-ion battery at low temperature. (B) Differential capacity analysis of the graphite electrode potential, Egr, in the three-electrode Li, Li, graphite cell, (B) Reproduced from Ref.[64], licensed under CC BY 4.0. (C) Transient full-cell voltage responses to 10 s charging pulses at different C-rates; (C) Reproduced from Ref.[66], licensed under CC BY 4.0. (D) Differential-pressure profiles (dP/dQ) of graphite/NMC532 pouch cells charged at 2 and 3 C, illustrating the rate-dependent onset of lithium plating; (D) Reproduced from Ref.[69], licensed under CC BY 4.0. (E) Calculated differences between local anode-edge and central potentials for different electrode overhang configurations during cycling; (E) Reproduced from Ref.[73], licensed under CC BY 4.0.