
fig3
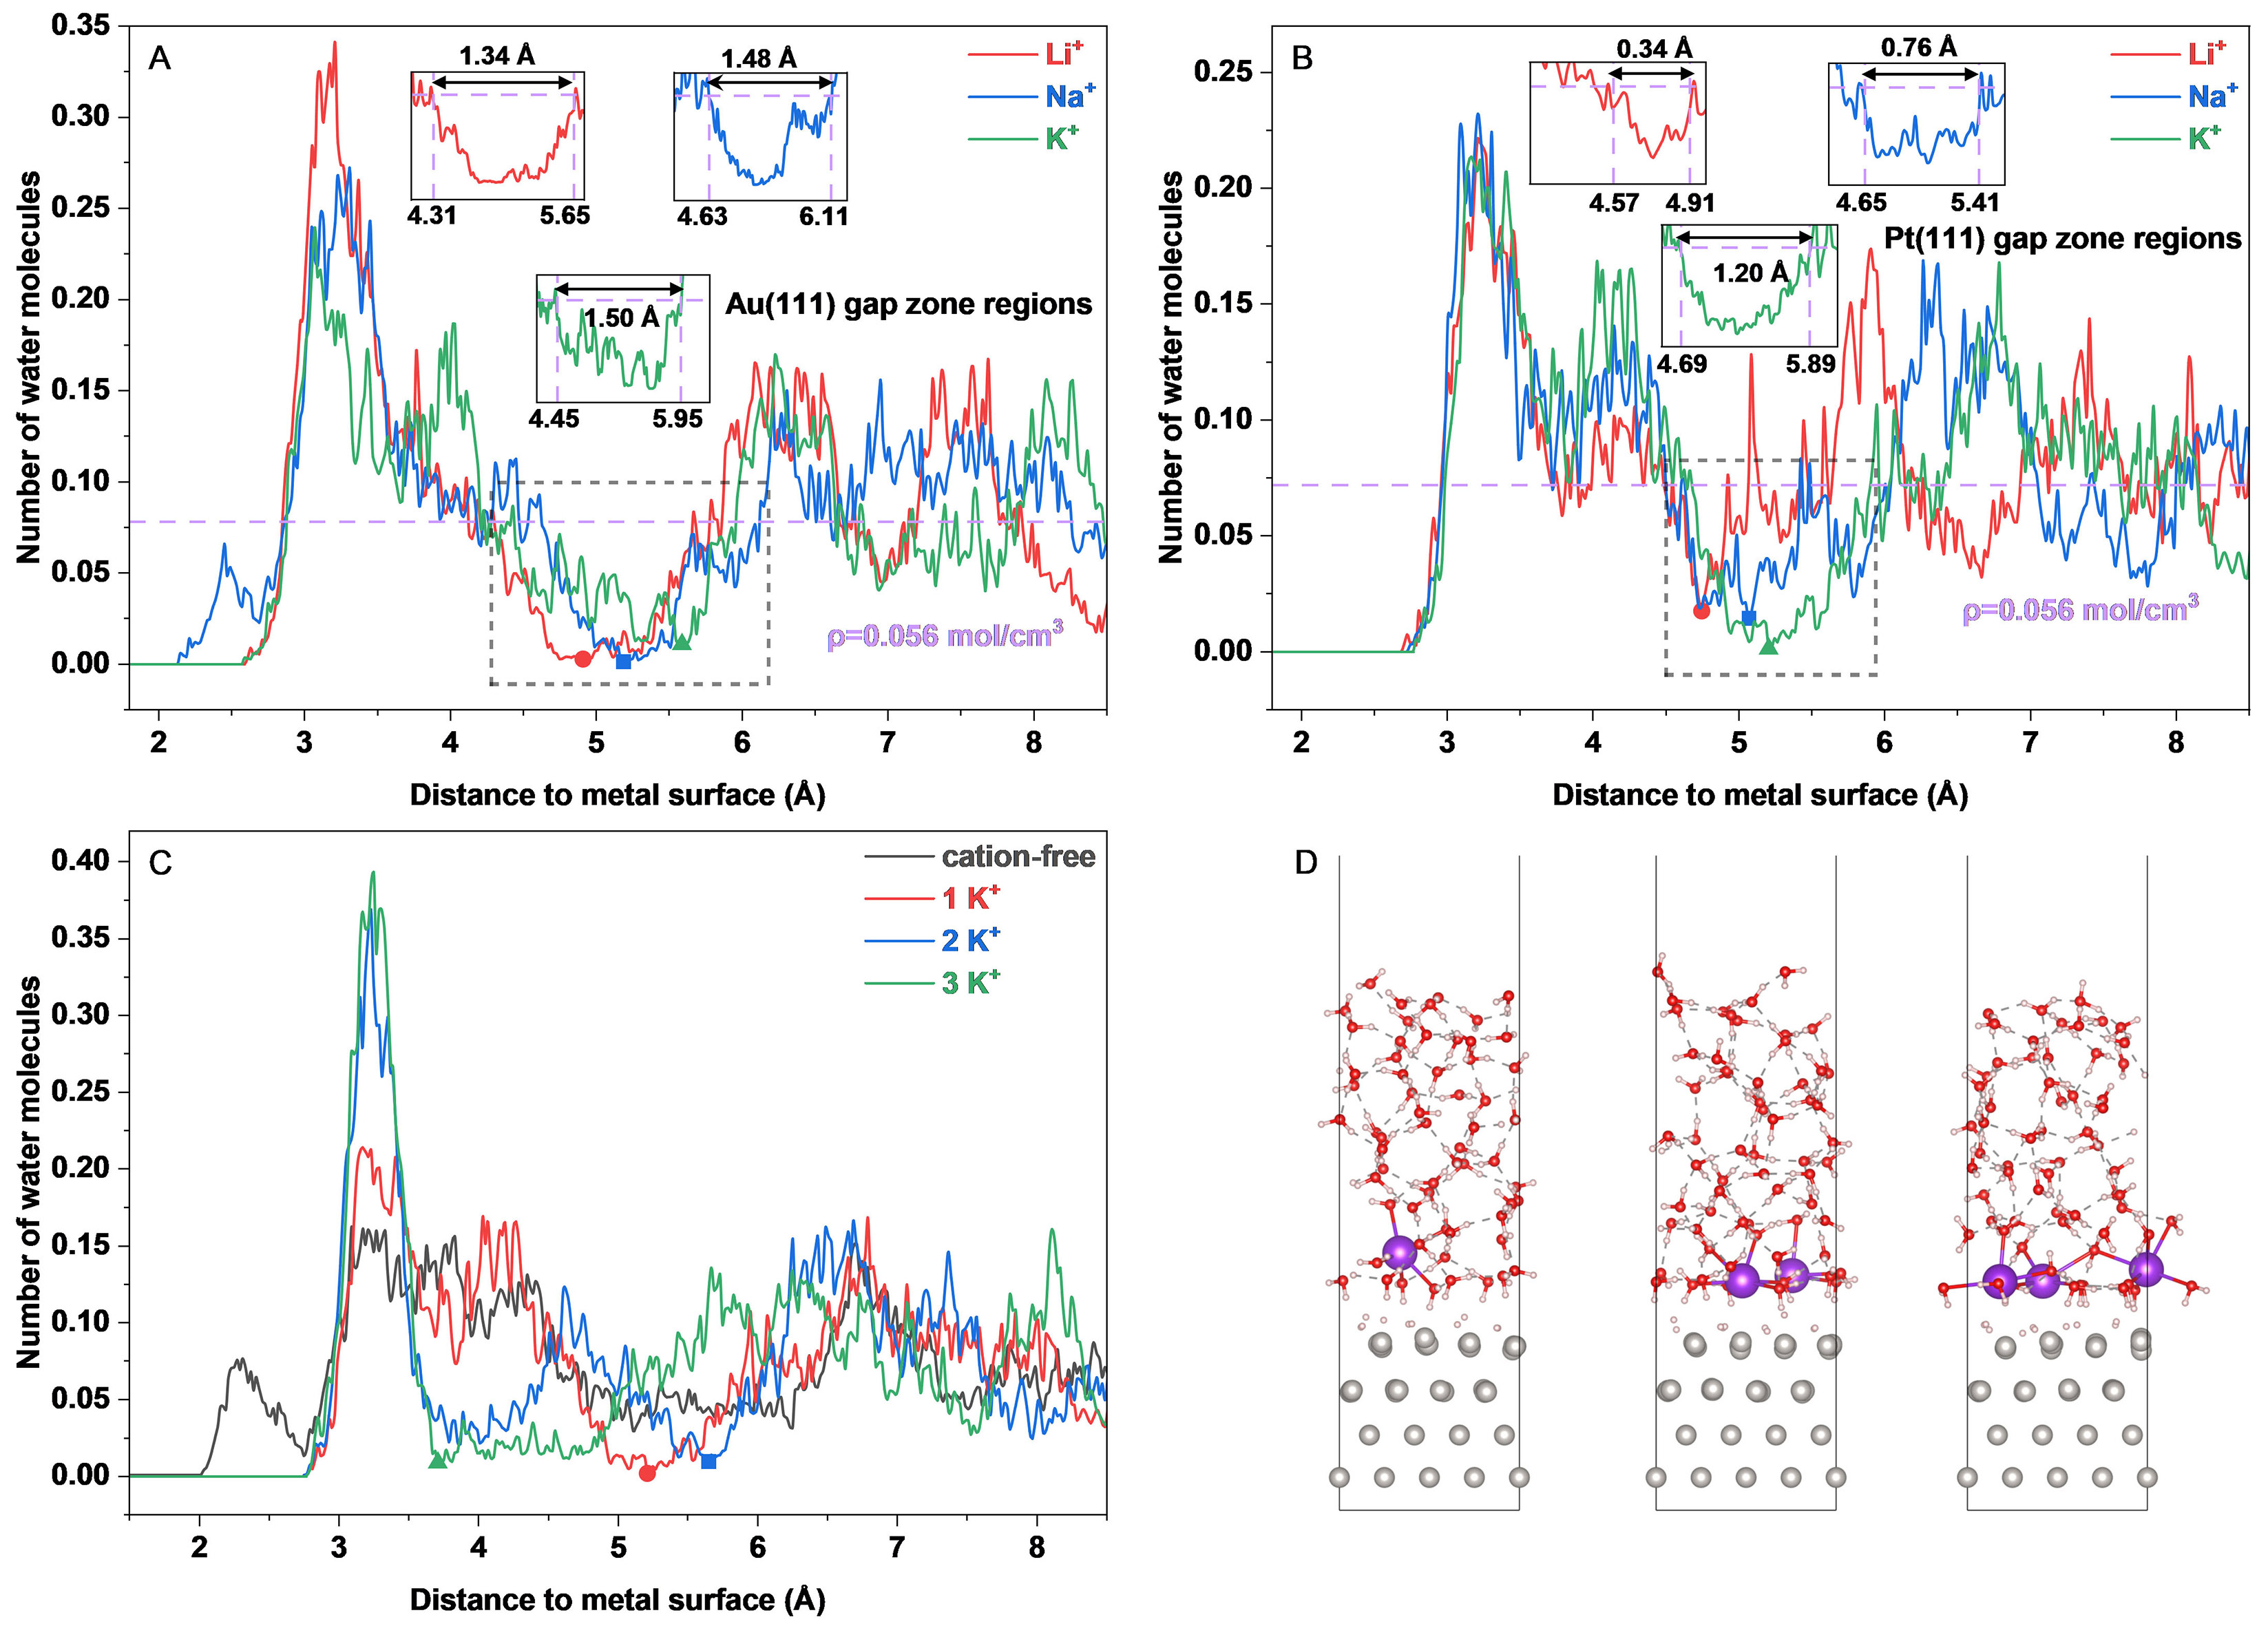
Figure 3. Interfacial water counts per spatial bin and representative configurations from AIMD. (A and B) Profiles for Li+, Na+, and K+ at (A) Au(111)/water and (B) Pt(111)/water interfaces, averaged over the final 5 ps of the unconstrained trajectories. Insets show the two reference-level crossings that delimit each local water-depleted region and its width in Å. The ordinate is the time-averaged number of water molecules per bin. Bins have a thickness of 0.02 Å and volumes of 2.32 Å3 for Au(111) and 2.13 Å3 for Pt(111). The purple line is the count equivalent of the bulk-water density, 0.056 mol cm-3: 0.08 molecules per bin in (A) and 0.07 in (B). Normalization and unit conversion are specified in Supplementary Text. (C) Profiles for Pt(111) without cations and with one, two, or three interfacial K+ ions. (D) Representative Pt(111)/water configurations containing one, two, and three K+ ions from left to right, rendered using VESTA 3.5.8.[53].