
fig3
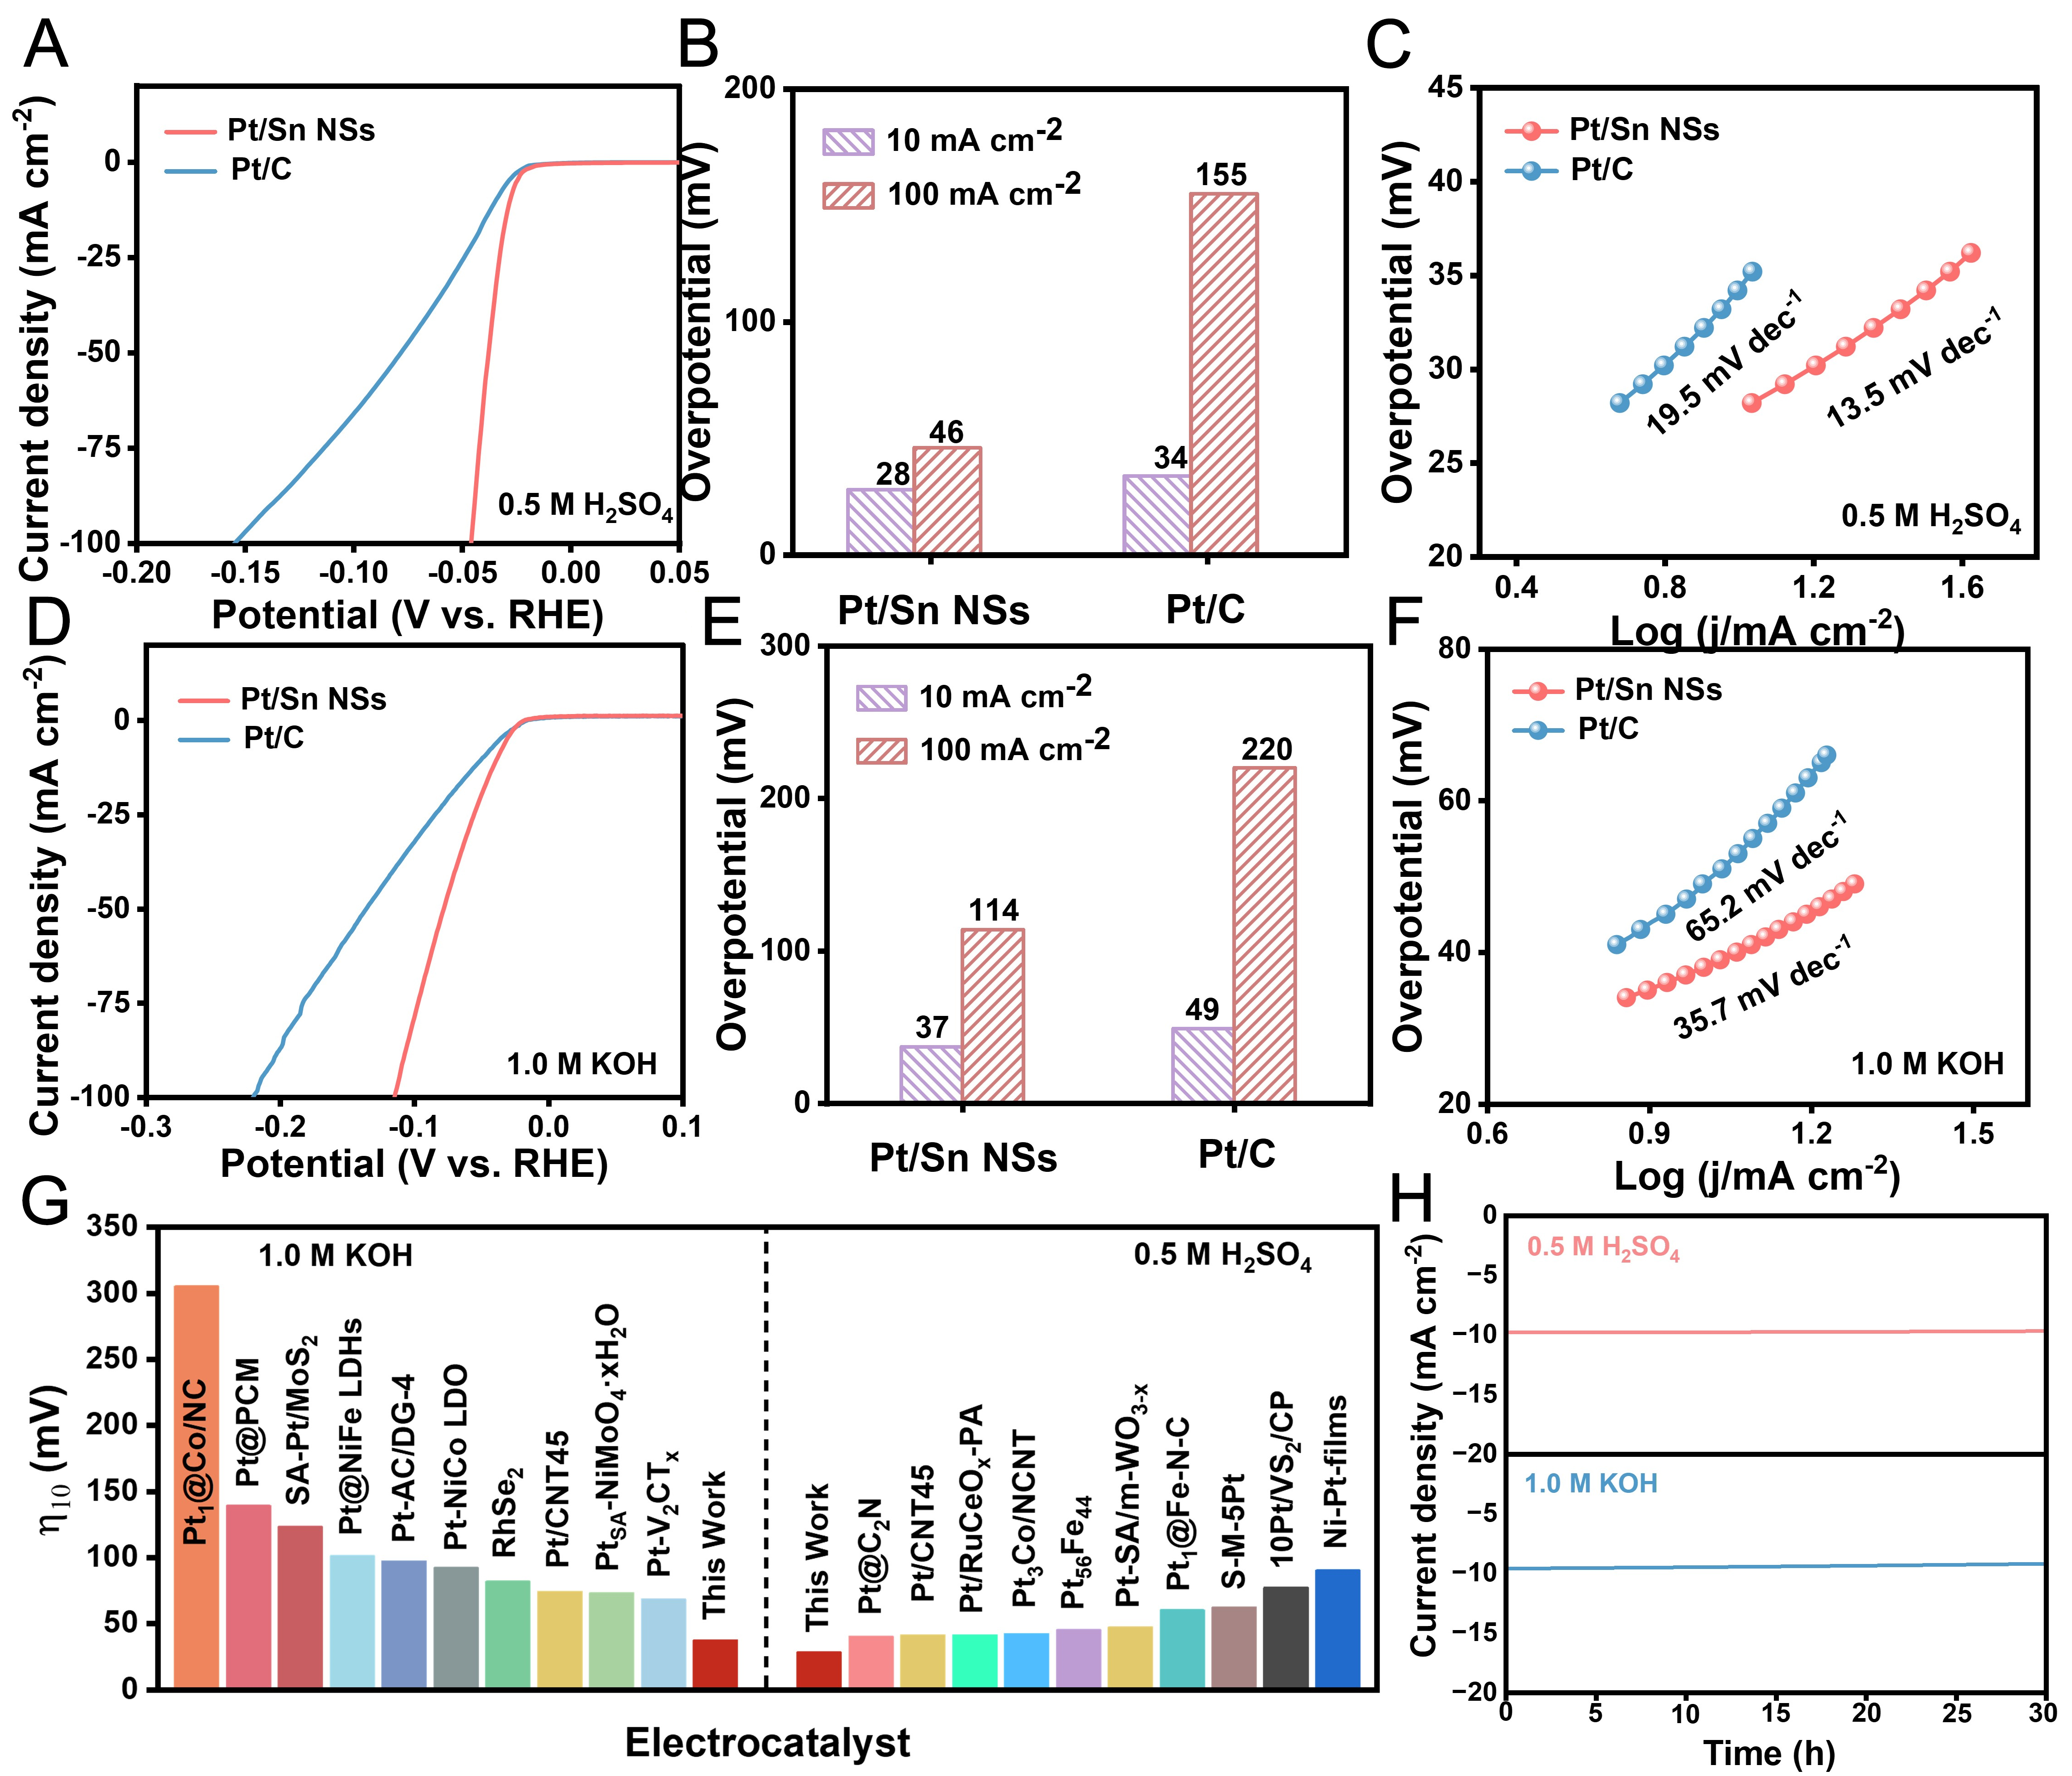
Figure 3. HER performance of Pt/Sn NSs and commercial 20 wt% Pt/C in acidic and alkaline electrolytes. (A-C) LSV polarization curves, overpotential comparison at current densities of 10 and 100 mA cm-2, and corresponding Tafel plots in 0.5 M H2SO4, respectively; (D-F) LSV polarization curves, overpotential comparison at current densities of 10 and 100 mA cm-2, and corresponding Tafel plots in