


Online degradation estimation for hybrid supercapacitors via data-driven enhanced pseudo-two-dimensional model
 0
0 
Abstract
Hybrid supercapacitor (HSC) delivers high power and energy densities for energy storage applications, but its pronounced temperature dependence and fluctuating capacity fade severely impede accurate state of health (SOH) estimation. Current algorithms focus solely on SOH and do not provide mechanistic understanding of degradation, which limits the effectiveness of hybrid supercapacitor health management. This study proposes a P2D-convolutional neural network (CNN) framework for online SOH monitoring and degradation mechanism analysis of HSC. A P2D model modified with the double-layer equation was employed to generate datasets via Latin hypercube sampling. This model was then coupled with a CNN to extract degradation-related features from incremental capacity curves through physics-data fusion, enabling reliable SOH prediction and quantitative assessment of electrochemical parameter degradation. Experimental results demonstrate that the proposed framework accurately captures the degradation mechanisms of HSC under fluctuating conditions, with the SOH prediction achieving an R2 of 0.9387 and a mean absolute percentage error (MAPE) of 1.57% across 13,898 cycles. These findings provide useful guidance for the design and health monitoring of HSC.
Keywords
INTRODUCTION
With the rapid development of renewable energy and clean transportation, the demand for energy storage devices that combine high energy density with high power density is growing rapidly[1-3]. Hybrid supercapacitors (HSC) have been widely studied, as they utilize dual capacitive-faradaic mechanisms to achieve high power and energy density[4]. Unlike conventional lithium batteries, HSC operate under high-rate charge/discharge conditions[5], and their capacity fade is highly sensitive to temperature with pronounced fluctuations, making state of health (SOH) prediction challenging[6,7].
The existing SOH prediction methods reported in the literature for energy storage devices can be grouped into three categories: equivalent circuit model (ECM)[8], data-driven approach[9], and mechanistic model[10]. ECM establishes mathematical descriptions to characterize the dynamic response and degradation of energy storage devices. Extensive studies have been conducted based on ECM frameworks for battery state-of-health estimation[11], internal resistance identification[12], and the evaluation of differently structured ECM in practical battery systems[13]. However, the ECM approach simplifies electrochemical processes and provides only limited degradation information. Under variable degradation modes, the prediction accuracy may decline.
Data-driven approaches, which build mathematical models solely from historical monitoring data, are flexible and adaptable for predicting degradation trends[14]. Data-driven SOH prediction typically involves learning the mapping relationships between aging-sensitive features and SOH through machine learning models, based on preprocessing and feature engineering of battery monitoring data. Aging-sensitive features are commonly derived from incremental capacity (IC) curves[15], voltage-time profiles[16], and temperature dynamics[17]. With the development of machine learning (ML) and artificial intelligence (AI), data-driven methods such as artificial neural networks (ANN)[18], support vector machines (SVM)[19,20], Gaussian process regression (GPR)[21], and long short-term memory (LSTM)[22] have attracted considerable attention. However, these approaches lack clear physical significance, and adequate data are required to ensure precision, making it difficult to interpret the underlying degradation mechanisms of HSC.
Mechanistic models, by contrast, employ reaction kinetics and porous electrode theory to capture physical-chemical processes[23]. For instance, electrochemistry-thermal coupled models have been employed to characterize long-term storage degradation behavior across varying temperatures[24], while simplified P2D models have also been developed to reduce the computational complexity of SOH prediction[25]. However, electrochemical model simulations involve intricate equation coupling and substantial computational overhead, making them unsuitable for lightweight system applications.
Given the limitations of single methods, hybrid approaches that integrate ML algorithms with electrochemical models have emerged as effective approach for SOH prediction. Various hybrid data-driven and fusion methods have been developed to improve the SOH prediction accuracy for lithium-ion batteries[26,27]. However, such studies mostly adopt capacity fade or internal resistance rise as degradation validation metrics rather than degradation modes within electrochemical frameworks[28]. In parallel, related research has verified the effectiveness of degradation-related indicators and proposed mechanism-based degradation models that highlight the critical role of degradation modes in SOH prediction[29,30].
Although the aforementioned hybrid approaches have offered innovative insights for SOH prediction of energy storage devices and have mitigated the limitations of single methods, they are mostly limited to evaluating SOH itself and lack mechanistic understanding of HSC degradation. It should be noted that SOH can only quantify the difference between the HSC’s remaining capacity and its initial capacity, but cannot reflect the intrinsic causes of degradation. HSC degradation is often induced by multiple factors, including electrode material loss[29], electrolyte decomposition[31], and Solid Electrolyte Interface (SEI) film thickening[32]. Accurately identifying these degradation mechanisms is crucial for optimizing battery energy management strategies and improving HSC safety management.
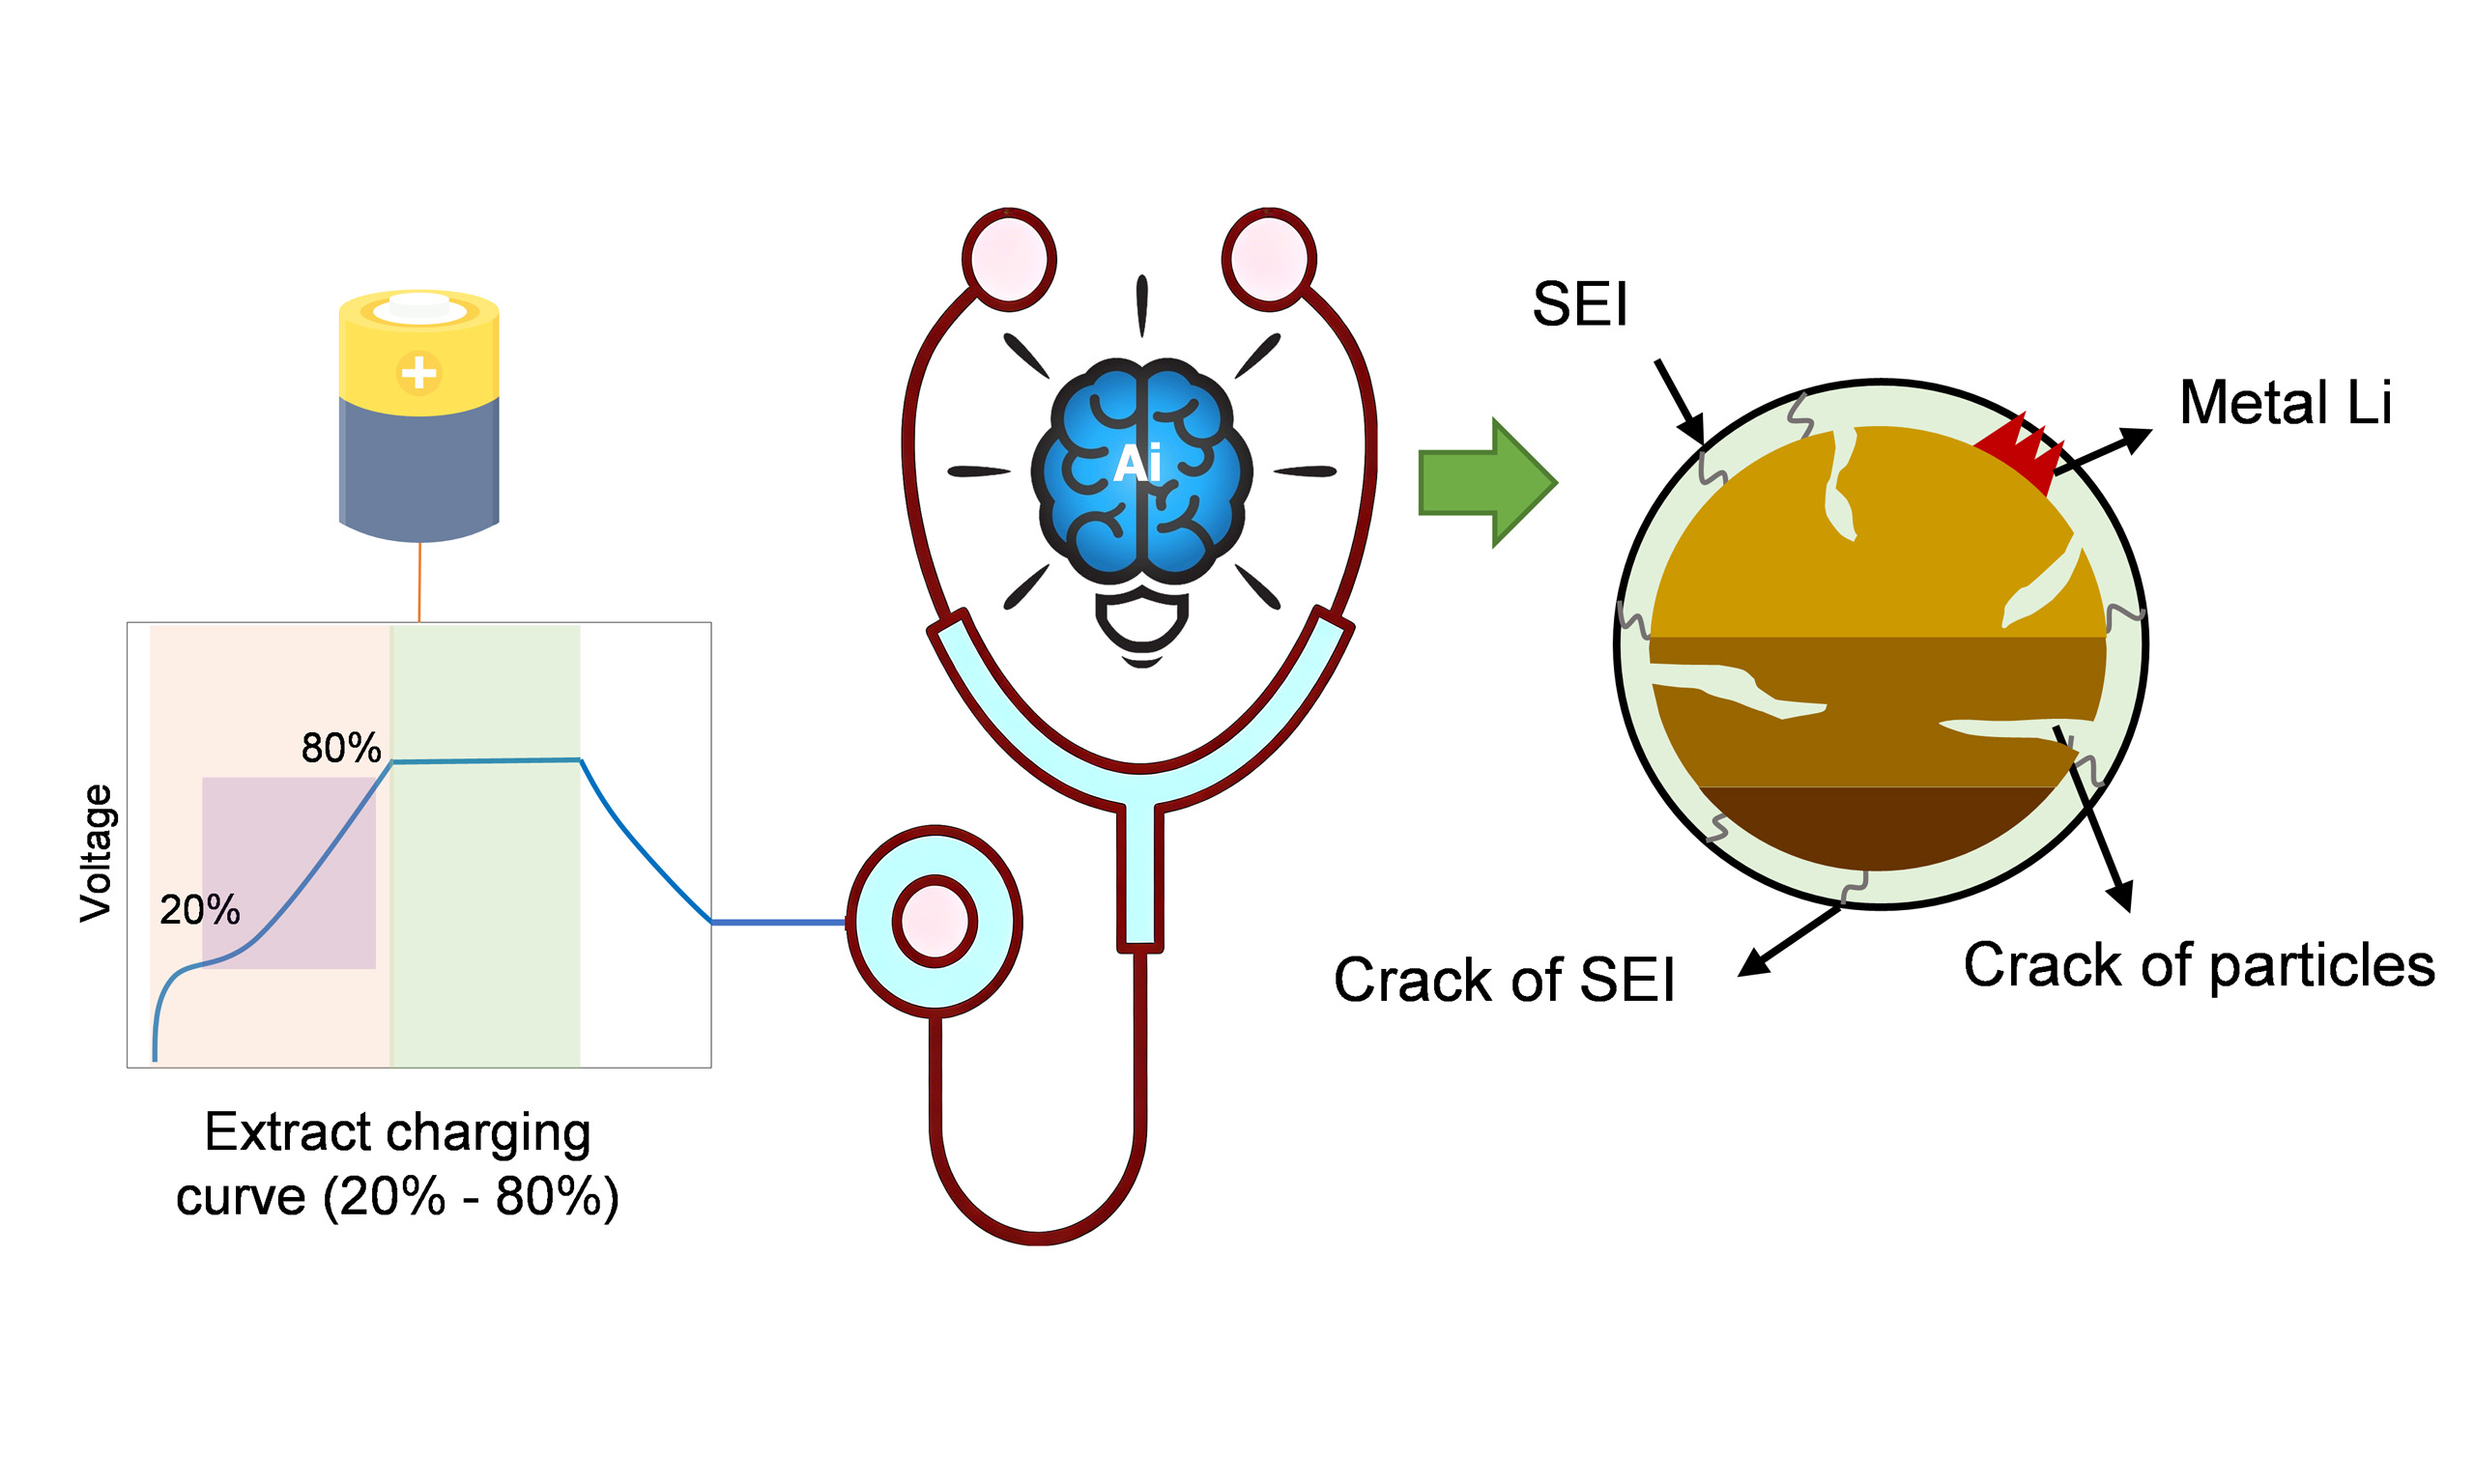
However, conventional approaches to obtaining degradation information exhibit clear limitations, as they rely on cumbersome offline experimental procedures, such as electrochemical impedance spectroscopy (EIS) analysis [33], scanning electron microscopy (SEM)[34], and compositional analysis[35]. Offline experimental procedures are incompatible with real-time online prediction scenarios. Therefore, acquiring detailed electrochemical information of HSC through non-destructive online methods to enable simultaneous SOH prediction and degradation mechanism analysis has become a key issue in the field of HSC state monitoring. The evolution of electrochemical parameters (e.g., active surface area, diffusion coefficient, and conductivity[36]) directly alters the characteristics of the IC curve. This implies that IC curves contain abundant electrochemical information related to parameter degradation, and it is theoretically feasible to invert and predict HSC degradation parameters from IC curves.
In summary, to meet the demand for rapid degradation evaluation of HSC, this work develops a hybrid P2D-convolutional neural network (CNN) framework that enables online identification of SOH and critical electrochemical parameters from real-time measured IC curves, without requiring time-consuming offline experimental procedures. The P2D model, modified with double-layer equations to capture the HSC’s capacitive properties, was first validated using experimental charging curves, then employed to generate IC curve datasets via Latin hypercube sampling of sensitive electrochemical parameters. Subsequently, the CNN was employed to automatically extract features from IC curves to establish mappings with SOH and electrochemical parameters, enabling the prediction of SOH and electrochemical parameters from IC curves. Finally, through cyclic experiments and HSC disassembly characterization, the accuracy of the SOH prediction and the effectiveness of electrochemical parameter evaluation were verified.
EXPERIMENTAL
Framework overview
A P2D‑CNN framework was developed to achieve online SOH prediction and electrochemical parameter degradation characterization for hybrid supercapacitors, as shown in Figure 1. Initially, HSC cycling experiments were performed, and the obtained charging curves were utilized to verify the P2D model. Latin hypercube sampling was subsequently implemented on sensitive electrochemical parameters based on the validated P2D model, and a dataset was generated to establish the correlations between IC curves and key parameters, including SOH as well as the aforementioned electrochemically sensitive parameters. The constructed dataset was then used to train a CNN model. The CNN architecture consisted of multiple convolutional layers (Conv1 to Conv4) for hierarchical feature extraction from IC curves, ReLU activation layers to introduce nonlinear transformations, a max-pooling layer for spatial dimensionality reduction, and a global average pooling (GAP) layer followed by dense layers to learn the mapping relationships between extracted features and key target outputs (i.e., electrochemical parameters and SOH). Detailed configurations of the CNN are provided in Supplementary Figure 1. Upon completion of model training, the CNN was employed to analyze IC curves obtained from additional HSC cycling processes. Accordingly, the model enables both the prediction of HSC SOH and the extraction of electrochemical degradation characteristics.
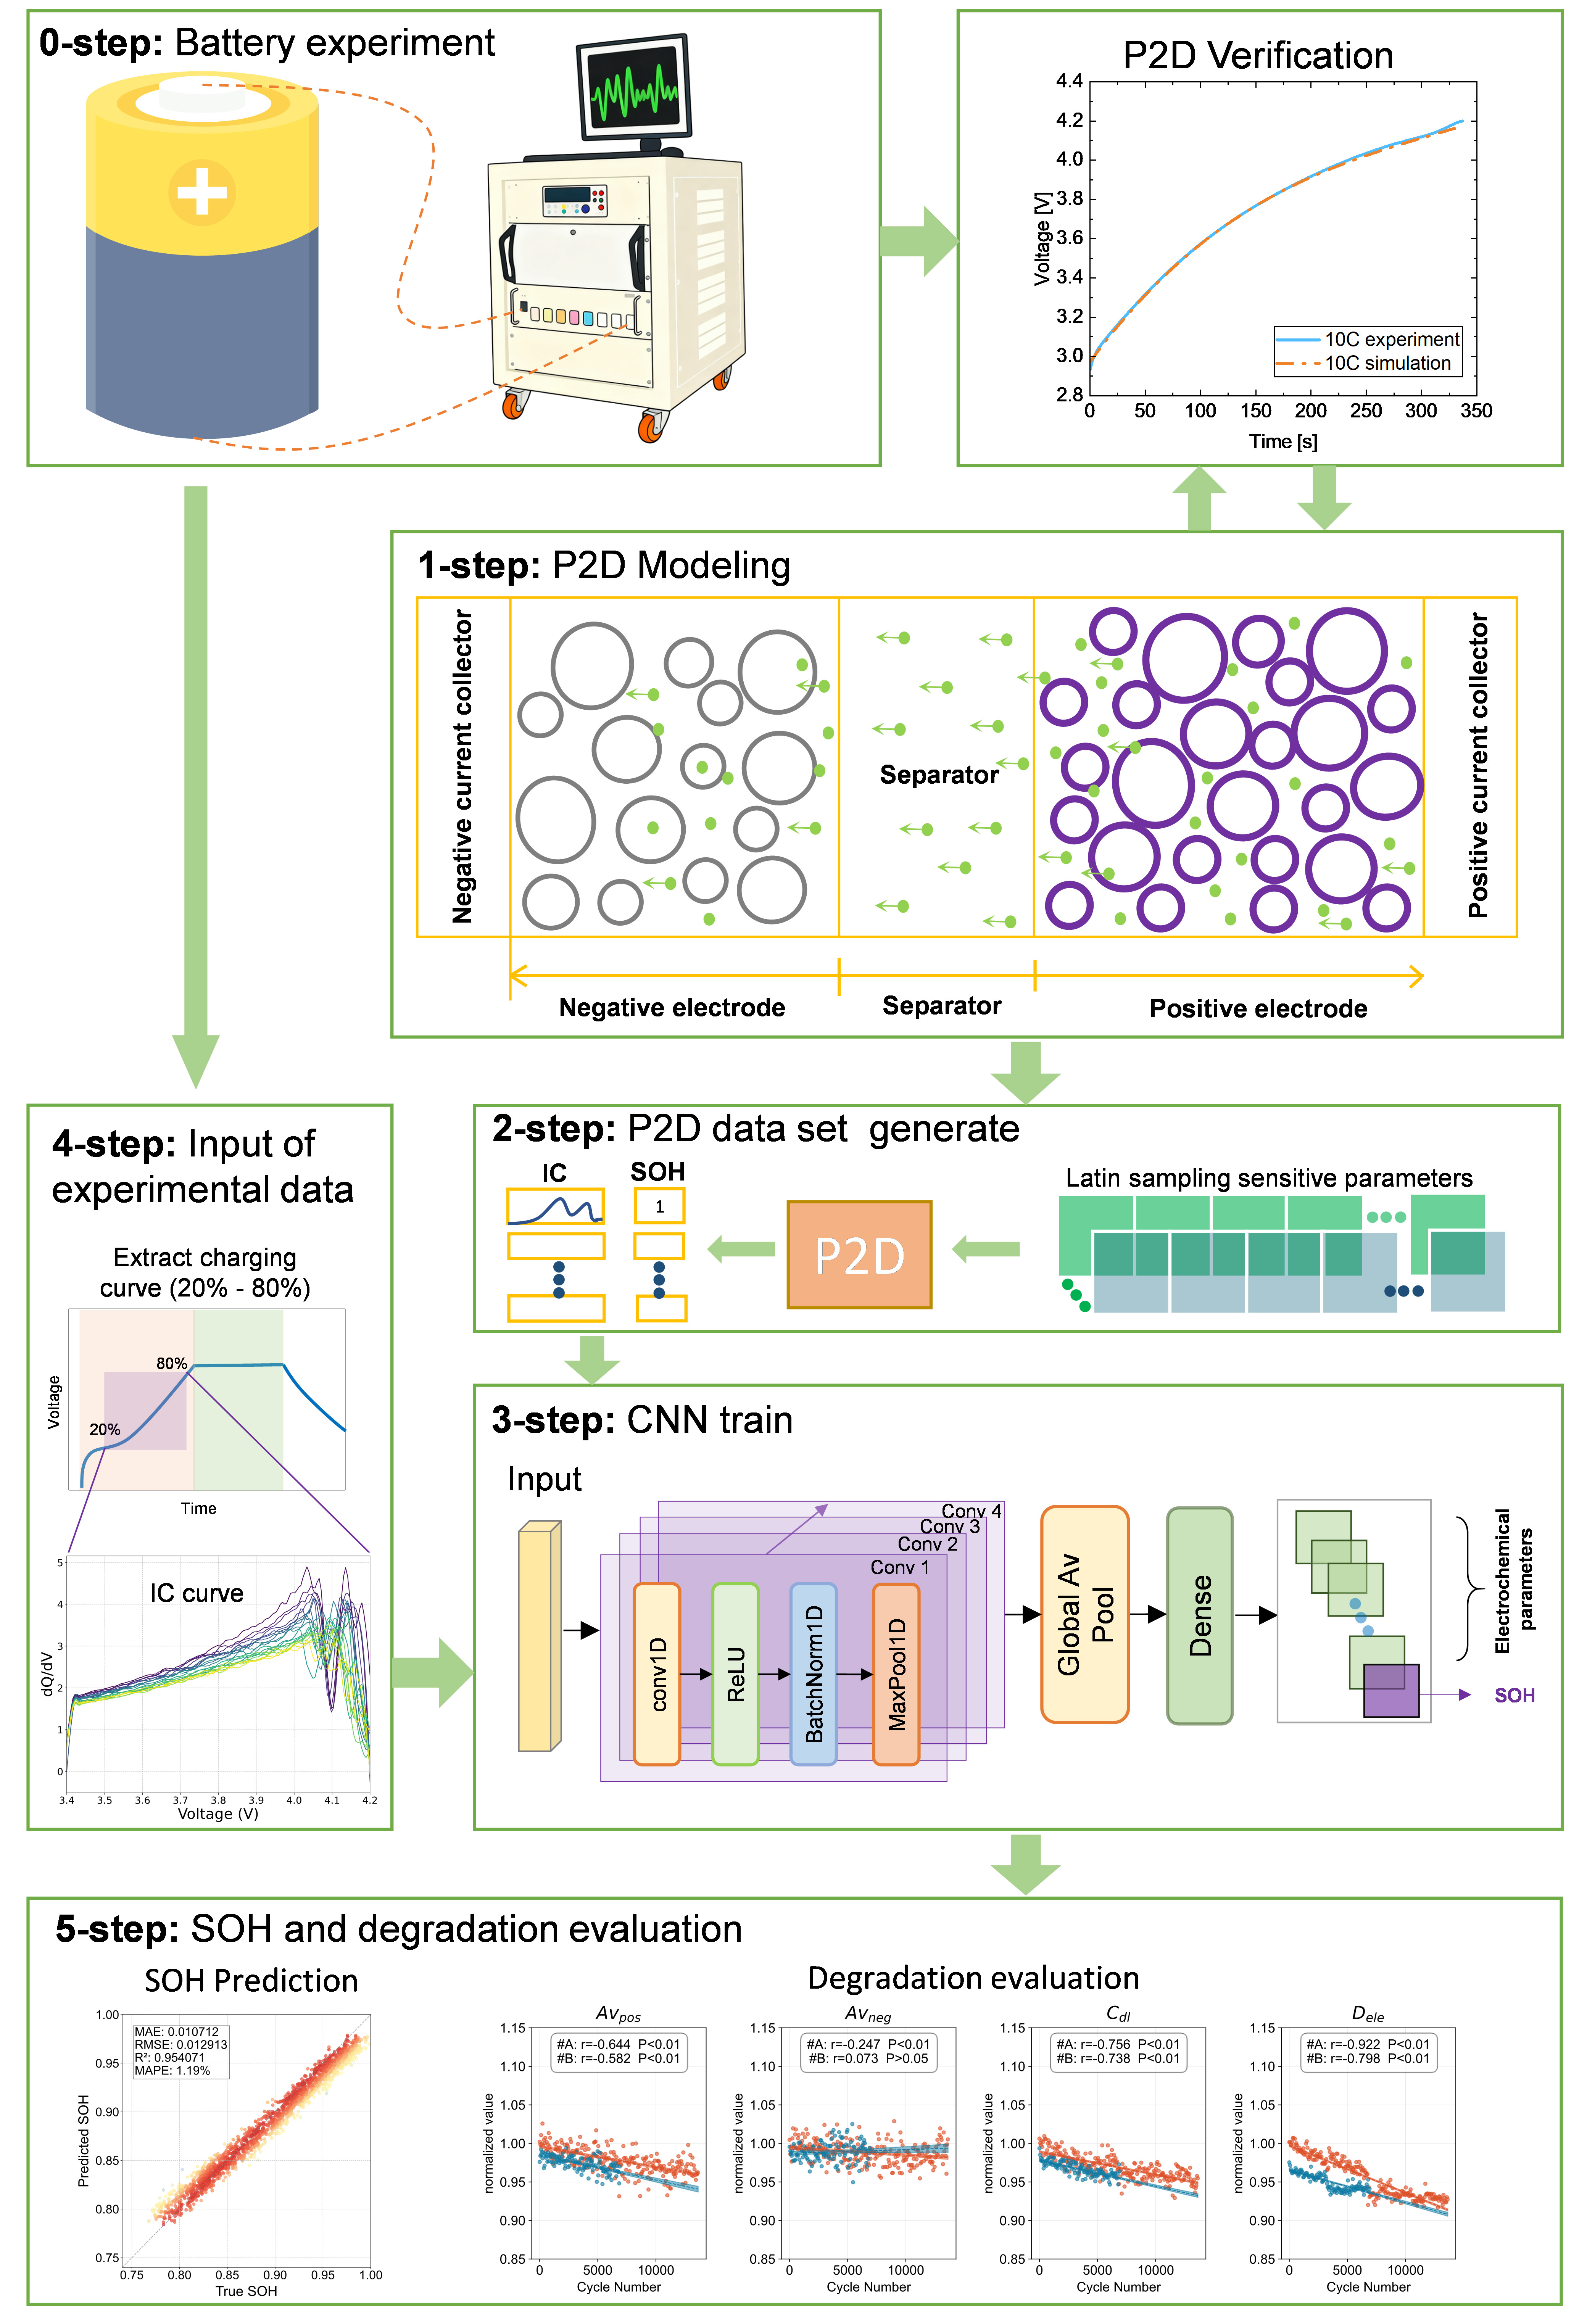
Figure 1. Flowchart of the proposed P2D-CNN method for hybrid supercapacitor SOH and degradation mechanisms estimation. CNN: Convolutional neural network; SOH: state of health; IC: incremental capacity.
Electrochemical model
Unlike ordinary lithium batteries, hybrid supercapacitors incorporate activated carbon in the positive electrode, enabling them to exhibit capacitive properties. The energy storage mechanism of the hybrid supercapacitor is shown in Figure 2. The energy storage mechanism of hard carbon and Nickel Cobalt Manganese (NCM) involves lithium-ion insertion into their interiors, whereas the energy storage mechanism of activated carbon relies on the electric double layer. During charging, lithium ions are released through detachment from the activated carbon surface and dissociation from within the NCM, then pass through the separator and insert into the hard carbon interior. During discharge, lithium ions dissociate from the hard carbon, some of which are inserted into the NCM structure, while the rest form a double layer on the surface of the activated carbon. Therefore, when establishing the hybrid supercapacitors model, the double-layer equation was incorporated into the positive electrode of the P2D model, enabling it to couple with the diffusion equation within the active particles. The P2D model equation is shown in Table 1.
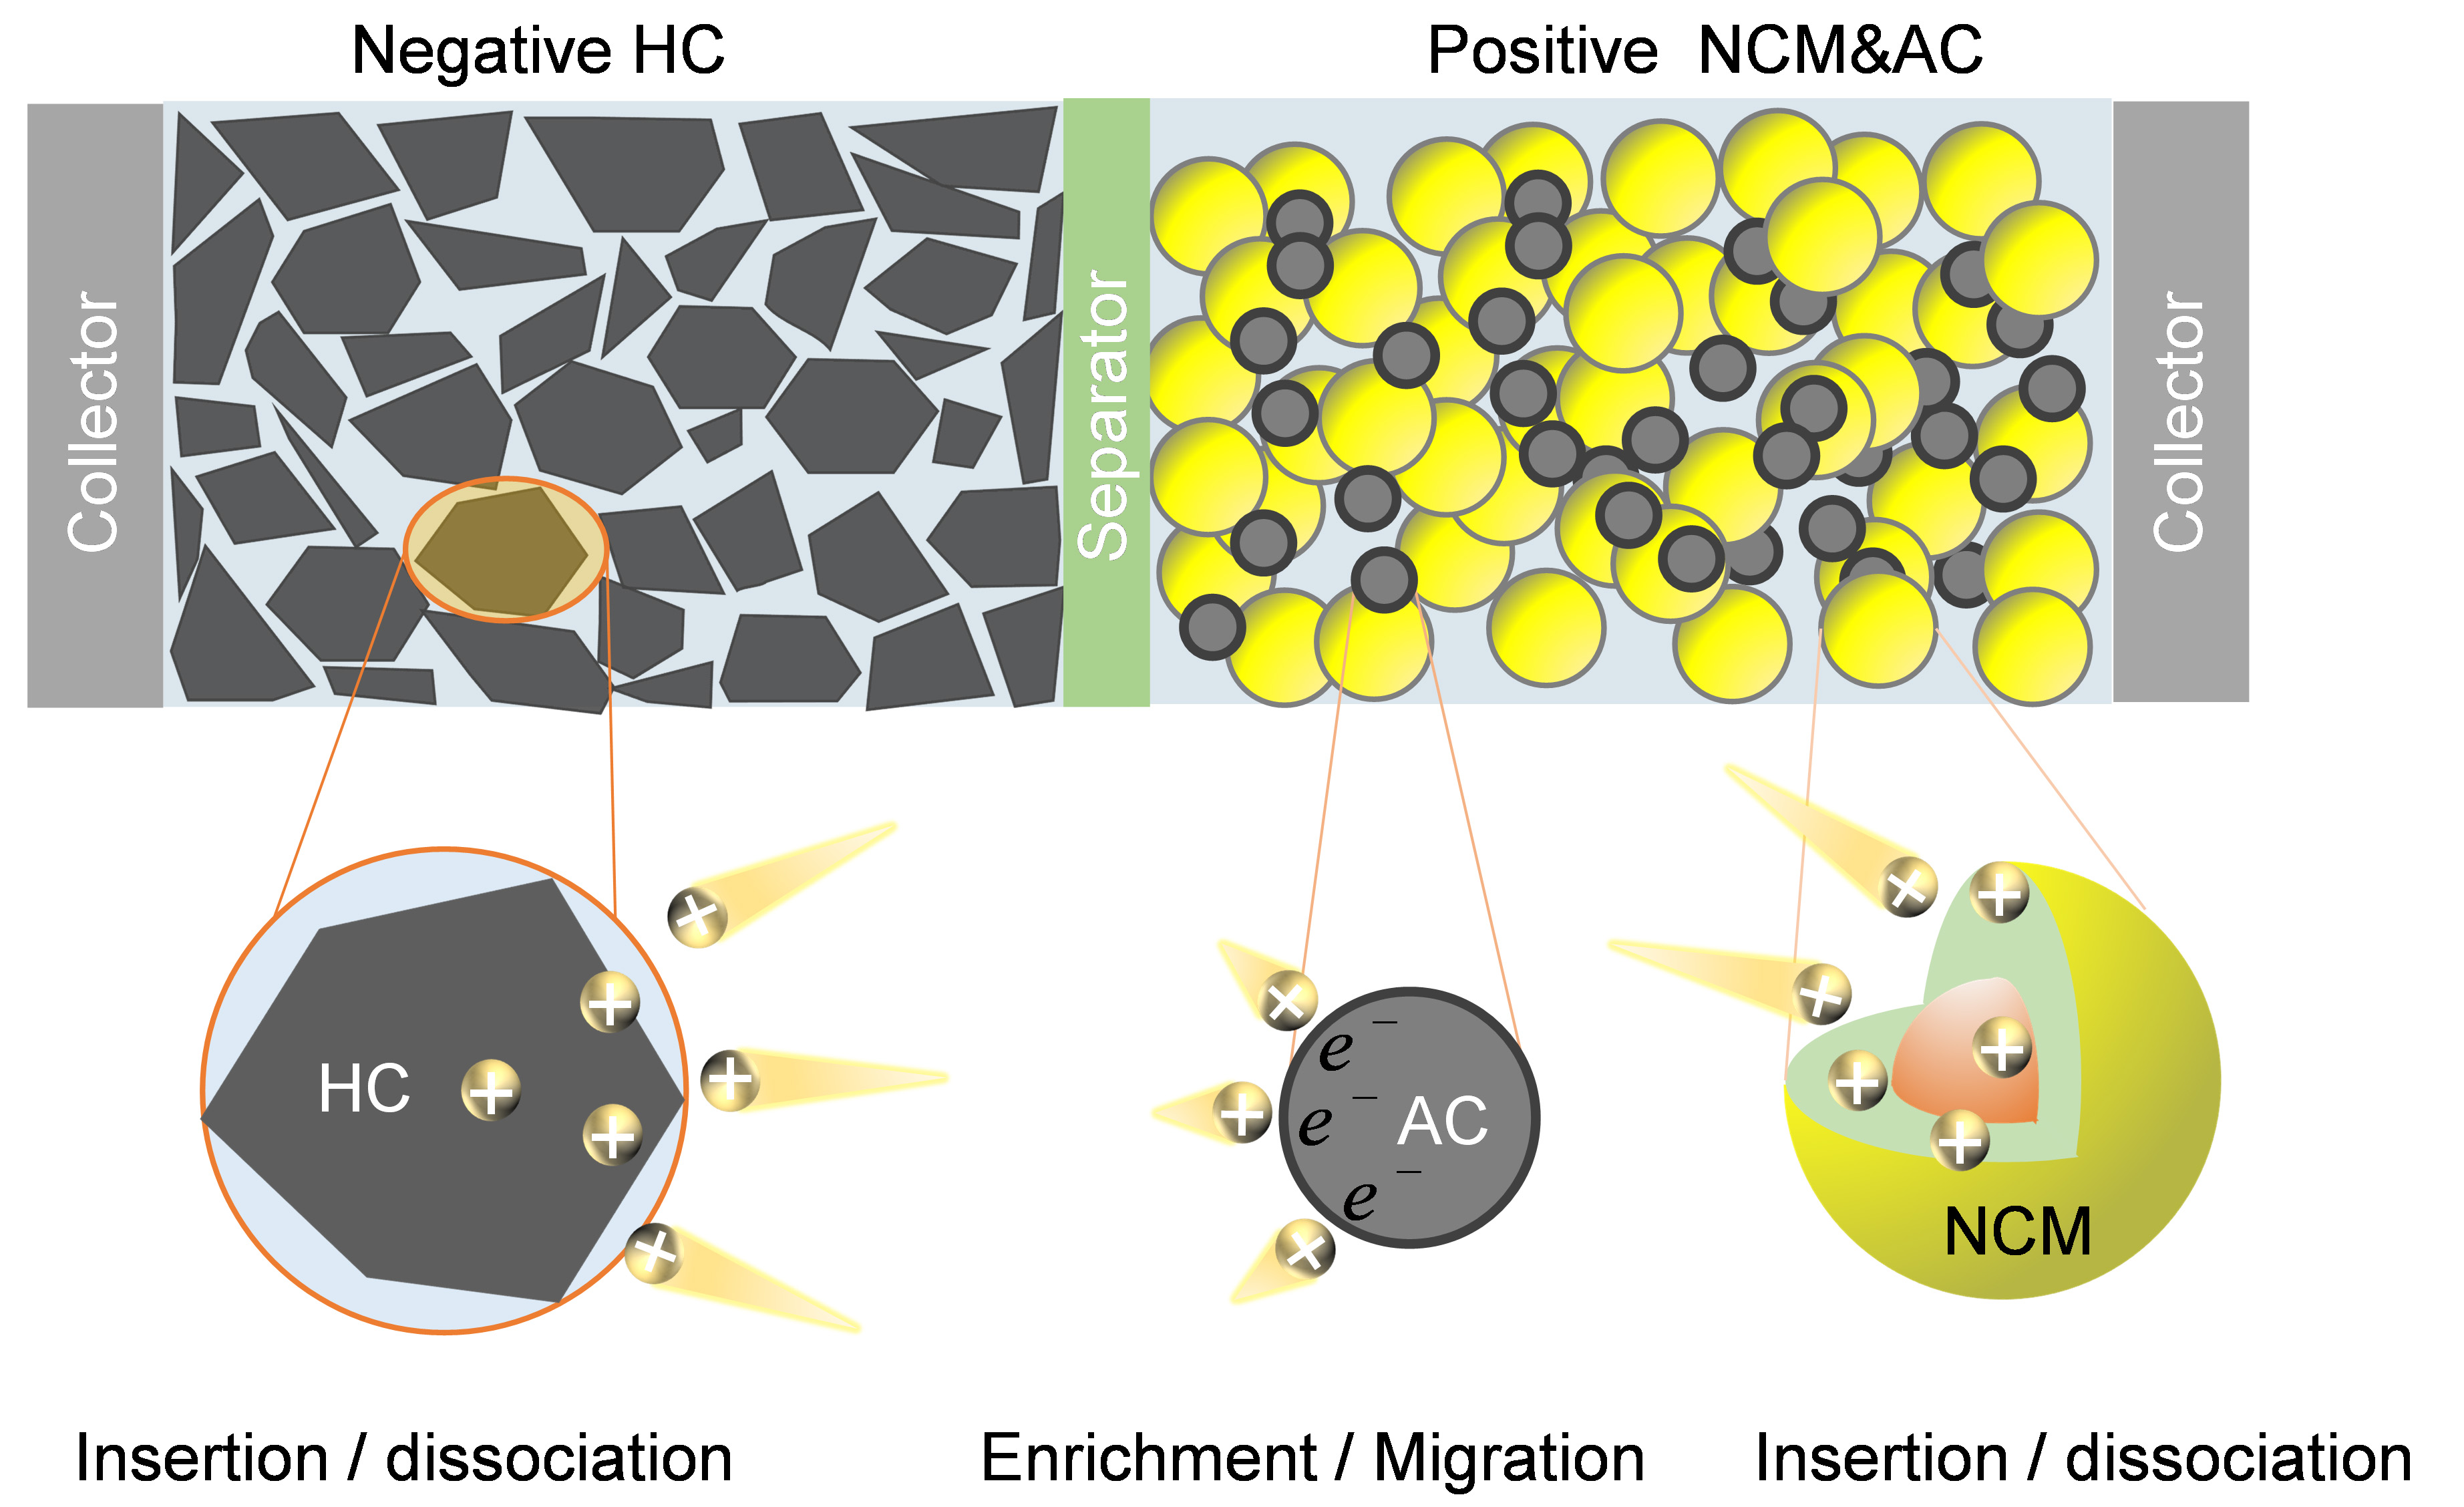
Figure 2. The energy storage mechanism of hybrid supercapacitors. HC: Hard carbon; NCM: nickel cobalt manganese; AC: activated carbon.
The P2D model of hybrid supercapacitors[36]
| Li diffusion | |||
| Solid-phase: | (1) | ||
| Electrolyte transport: | (2) | ||
| Conservation equation for electric charge | |||
| Solid state potential | (3) | ||
| Electrolyte potential | (4) | ||
| Interfacial reaction kinetics | |||
| Butler-Volmer equation | (5) | ||
| Exchange current density | (6) | ||
| Double layer current | (7) | ||
Model verification
The P2D model was validated by applying a Bayesian optimization algorithm to fit the experimental charging curve and identify the electrochemical parameters. A comparison between the experimental data and simulated results is presented in Figure 3. Specifically, the selected charging curve was from the first cycle of the HSC aging experiment. The simulated charging curve closely matched the experimental data in the early stage [Figure 3A], while minor deviations were observed in the later stage. From the IC curve [Figure 3B], the key characteristics were largely consistent. The agreement between simulation and experiment is sufficient to support the analysis of electrochemical mechanisms within the HSC. The identification results of the electrochemical parameters are provided in Supplementary Table 1.
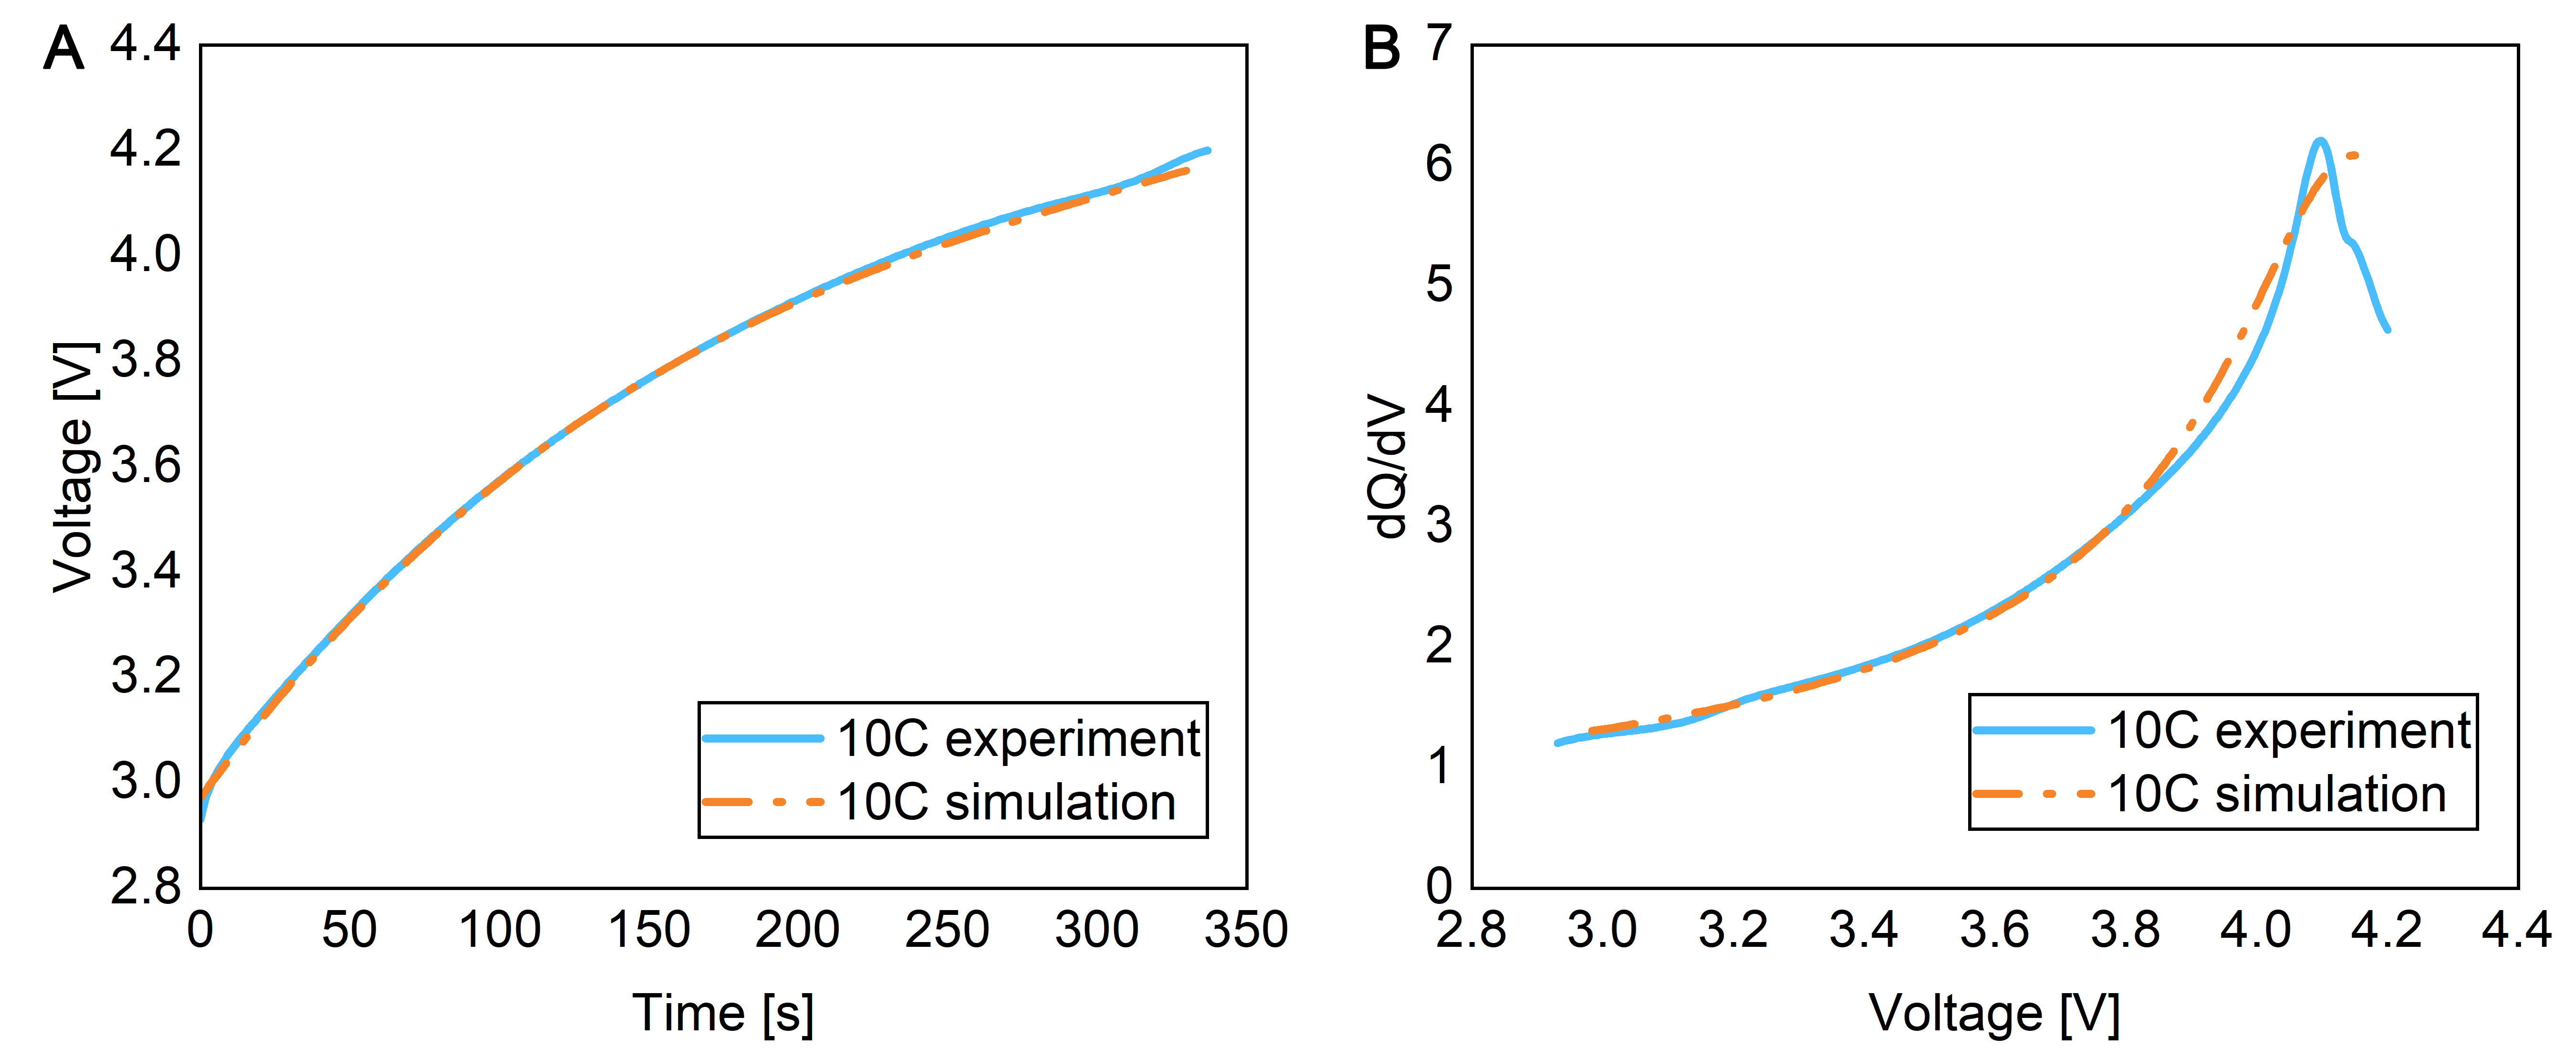
Figure 3. Comparison of simulated and experimental charging curves (A) and IC curves (B). IC: Incremental capacity.
Sensitivity analysis
To predict electrochemical parameters from IC curves, it is necessary to determine the sensitivity of these curves to electrochemical parameters. Thirteen parameters that characterize electrochemical performance were selected as sensitive parameters; other parameters (e.g., thickness and electrode area), which are inherent properties, were not included. Sensitivity analysis was performed by fluctuating each parameter by 20%, followed by calculating the differences between the resulting voltage curves and the original voltage curve. The normalized differences of charging curves within the voltage range are presented in Figure 4A. Note that parameters on the vertical axis are sorted by sensitivity, with the bottom parameters being the most sensitive. Except for Dpos, Dneg, σpos, and σneg, fluctuations in other parameters cause notable differences in the charging curves within the 3.6-4.2V range. These pronounced fluctuations indicate that charging curves contain abundant electrochemical information, which facilitates the identification of electrochemical parameters from such curves.
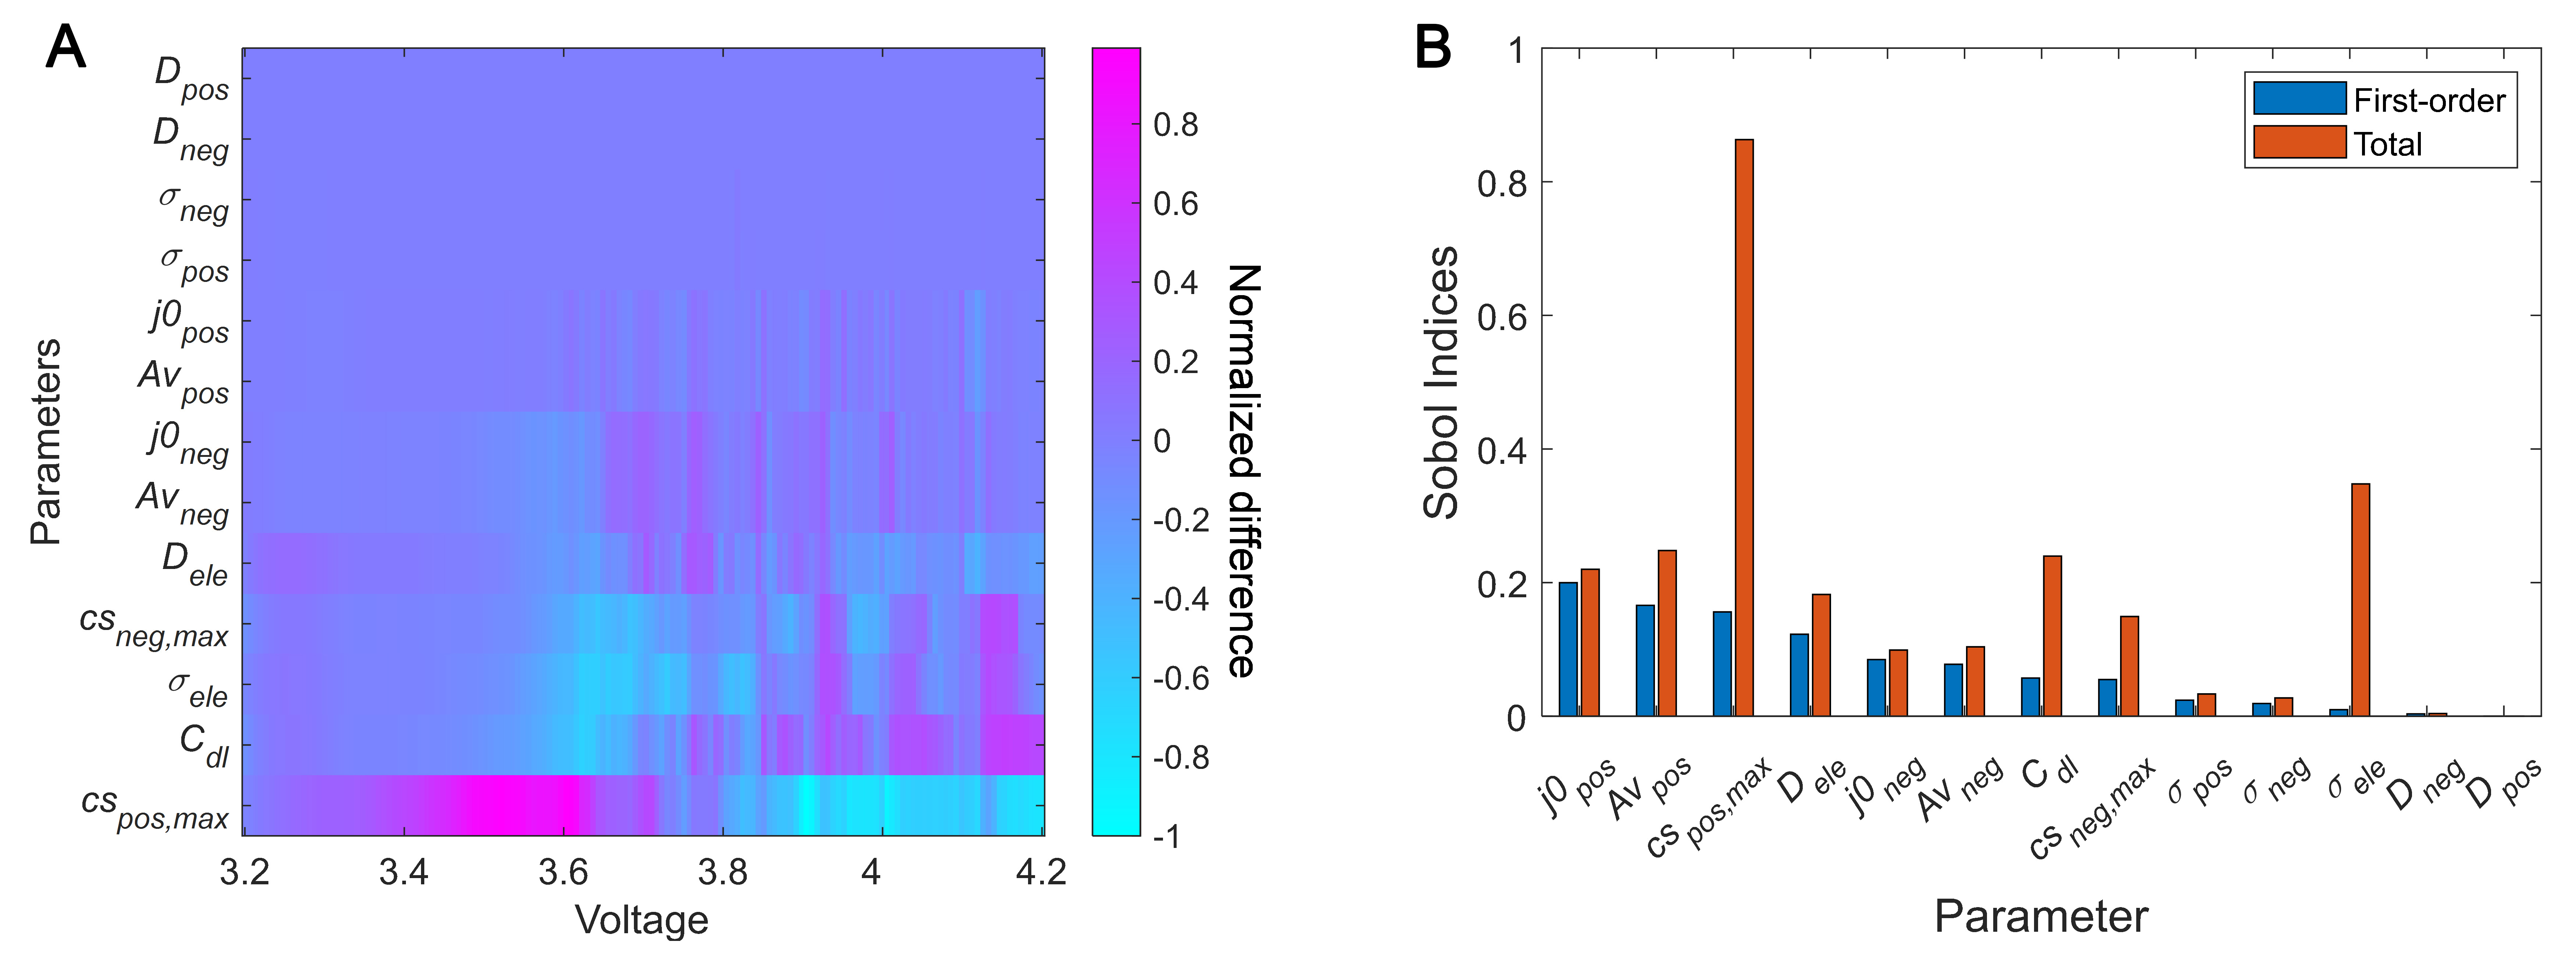
Figure 4. Sensitivity analysis of electrochemical parameters in P2D model. (A) Normalized differences of the charging curves in the voltage range under the variation of electrochemical parameters; (B) Sobol sensitivity analysis of the influence of electrochemical parameters on the charging curve.
For a quantitative assessment of parameter sensitivity, Sobol sensitivity analysis was carried out, as shown in Figure 4B. The first-order index reflects the direct influence of a single parameter on the charging curve, while the total index reflects the combined influence of individual parameters and their interactions. The first-order Sobol indices of Dpos, Dneg, σpos and σneg are extremely small, suggesting these parameters may not be identifiable from charging curves. Conversely, the total Sobol index of Cspos, max is considerably high, indicating its identification accuracy from charging curves may be reduced due to interactions with other parameters. In other words, identical charging curves may result from various parameter combinations, which increases the difficulty of parameter identification. Thus, only nine parameters with higher first-order indices (listed in Table 2) were selected for subsequent model training. To verify the uniqueness of the mapping of the IC curve to the electrochemical state, an inverse model verification was carried out, with detailed description and validation provided in the Supplementary Materials [Supplementary Figures 2 and 3].
The selected sensitive electrochemical parameters and their Sobol indices
| Parameter | Physical significance | First-order | Total |
| Av pos | Positive electrode active surface area | 0.1659 | 0.2479 |
| Av neg | Negative electrode active surface area | 0.0777 | 0.1039 |
| C dl | Activated carbon capacitance | 0.0572 | 0.2396 |
| D ele | Electrolyte diffusion coefficient | 0.1226 | 0.1823 |
| σ ele | Electrolyte conductivity | 0.0098 | 0.3064 |
| Cs neg, max | Maximum lithium concentration in the negative electrode | 0.0549 | 0.1492 |
| Cs pos, max | Maximum lithium concentration in the positive electrode | 0.1561 | 0.8330 |
| j 0,ne g | Negative electrode exchange current density | 0.0848 | 0.0990 |
| j 0,pos | Positive electrode exchange current density | 0.1998 | 0.2199 |
Surrogate model
To establish the surrogate model of the P2D, 10,000 data combinations of the selected 9 parameters normalized to the range 0.5-1 were sampled using Latin hypercube sampling, and the corresponding charging IC curves were generated by solving the P2D model via the finite element method. Then, 80% of the data was used for neural network training, and the remaining 20% was set as the test set. Here, a CNN was employed to automatically extract features from the IC curve and correlate the SOH with other electrochemical parameters. This approach avoids manual extraction of curve fluctuation features, which reduces information loss and minimizes negative impacts on recognition accuracy.
The model training results are presented in Figure 5. The IC curve enables accurate prediction of SOH, with a coefficient of determination (R2) of 0.92 and a maximum mean absolute percentage error (MAPE) of only 0.98%. Thus, the IC curve contains sufficient characteristic information to establish correlations with SOH. However, a small probability of substantial prediction errors exists for parameters Avpos, σele, and j0,neg, with the minimum R2 reaching 0.80 and the maximum MAPE reaching 6.2%. This level of recognition accuracy is sufficient for tracking the evolution of their electrochemical performance over multiple cycles.
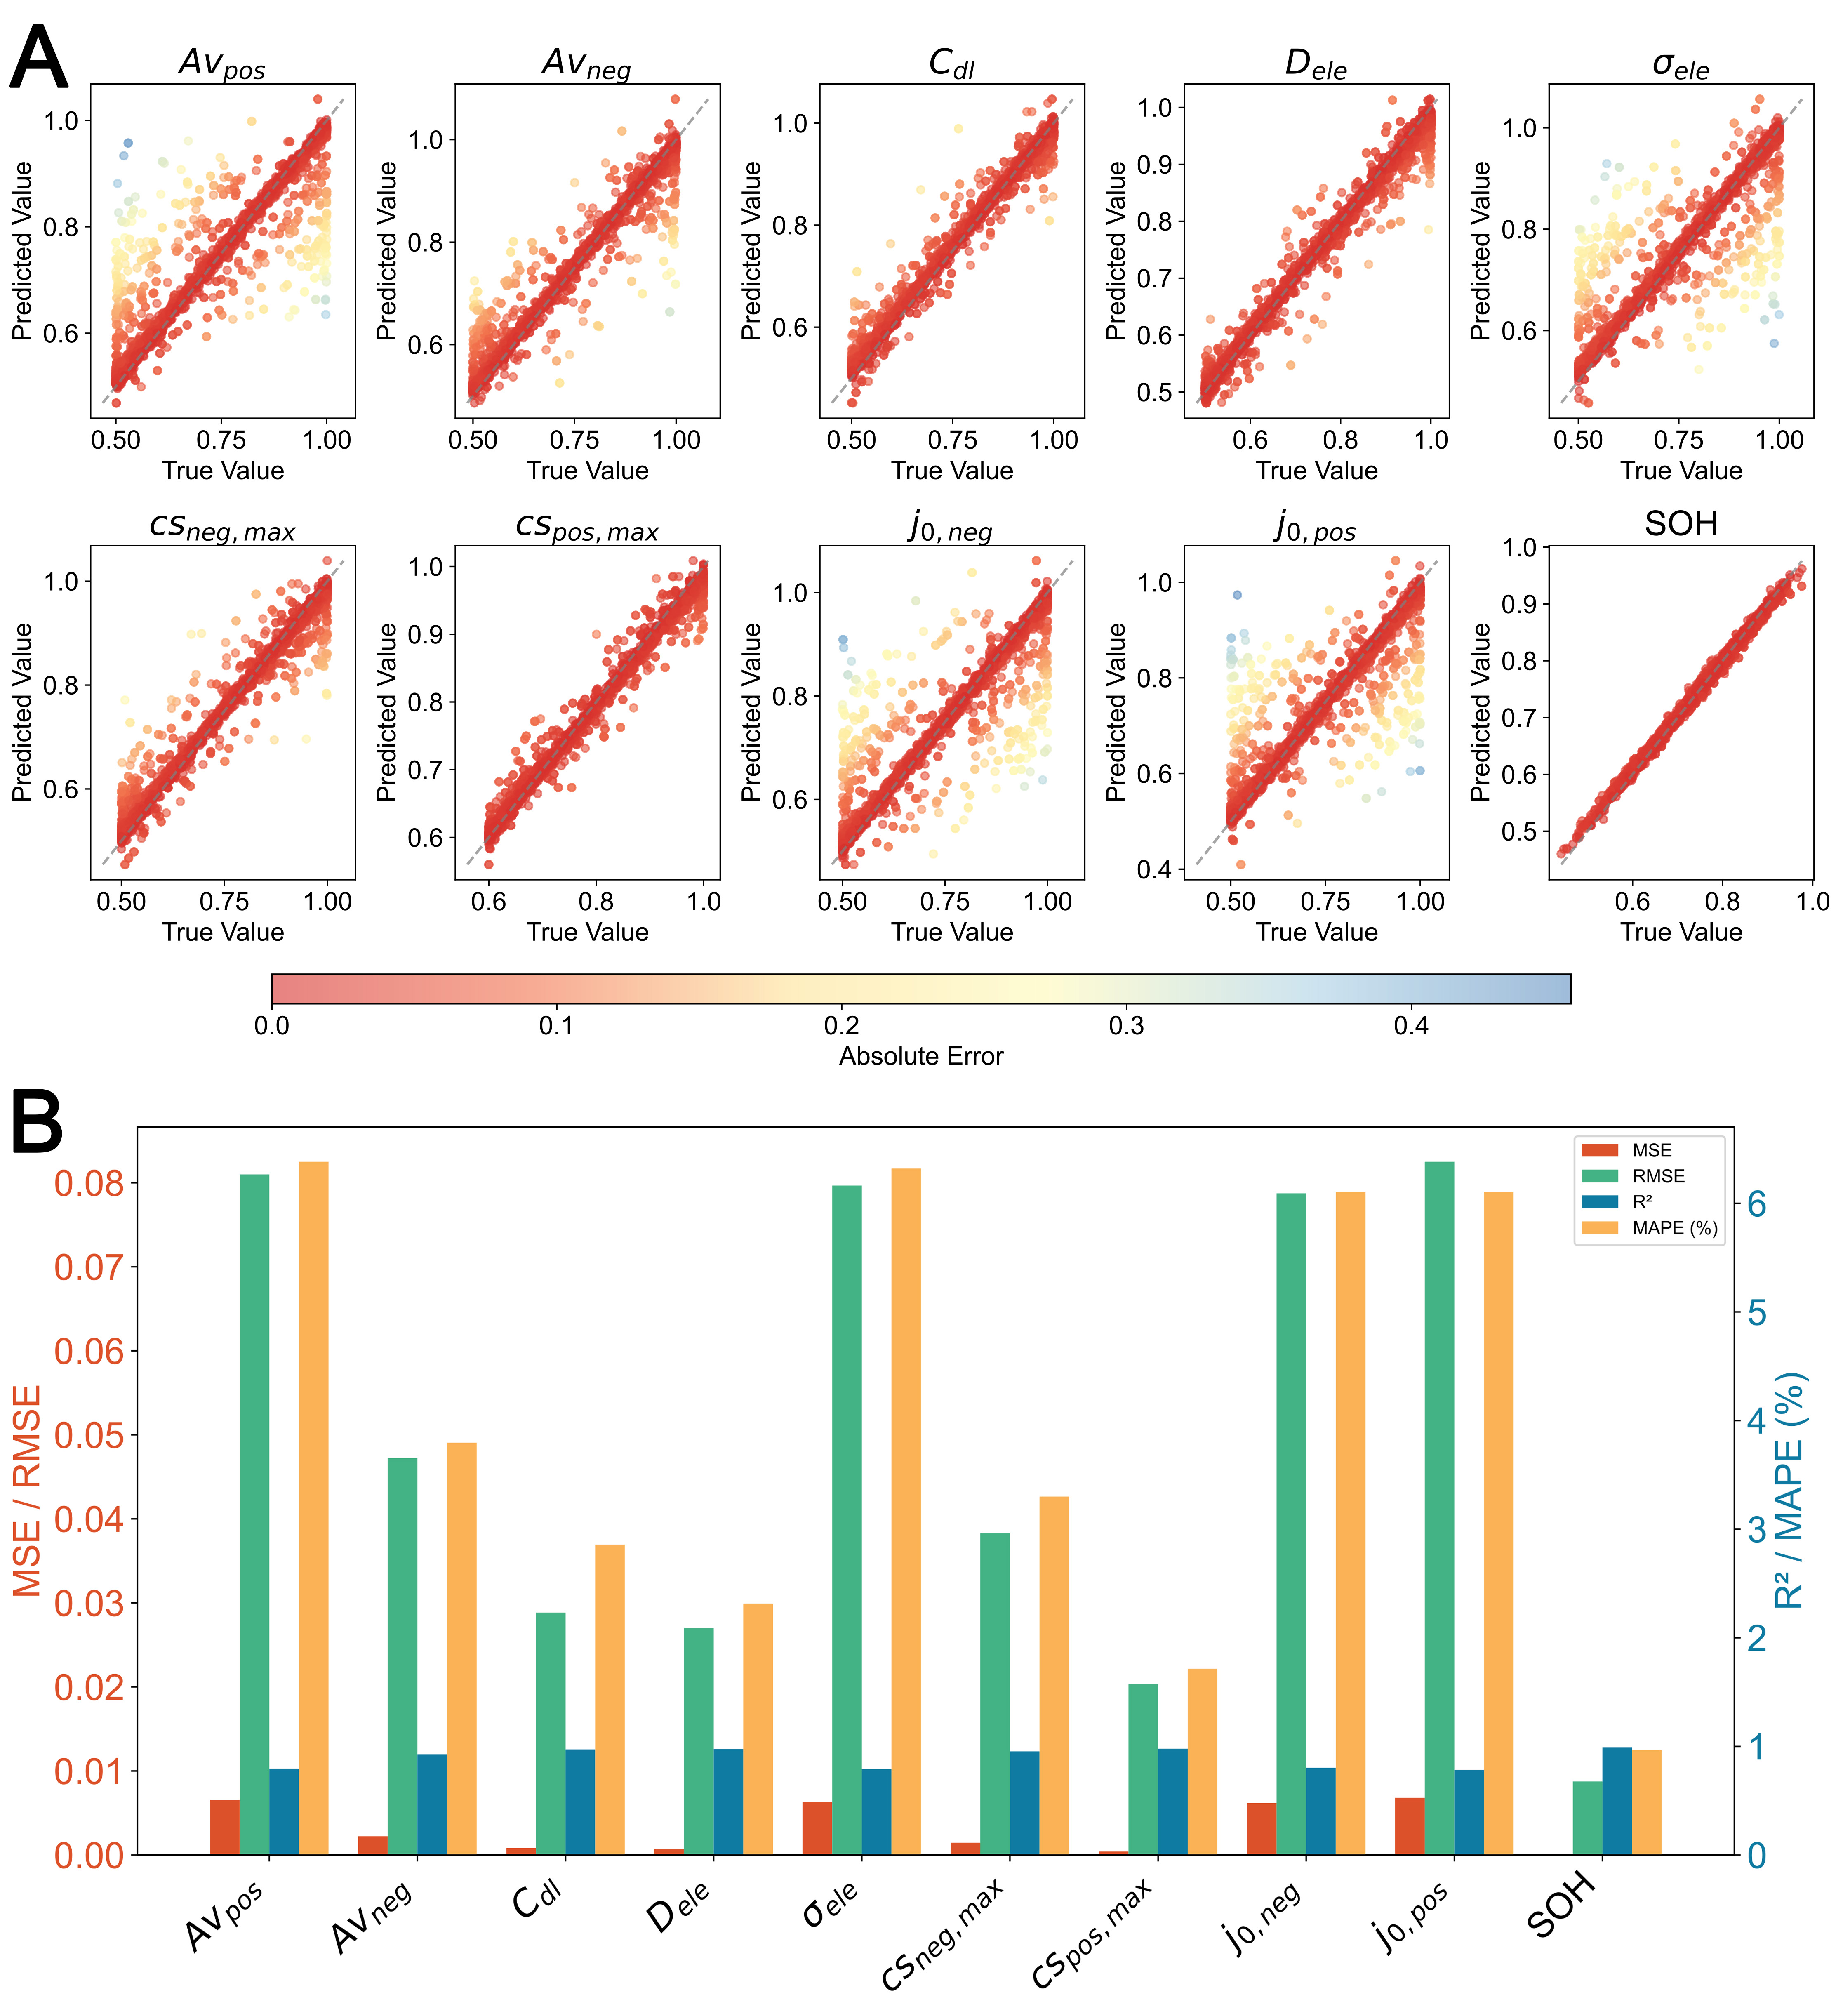
Figure 5. Identification results of the CNN model for sensitive electrochemical parameters and SOH. (A) Comparison of true values with predicted values; (B) error analysis of the predicted results. CNN: Convolutional neural network; SOH: state of health; MAPE: mean absolute percentage error; MSE: mean squared error; RMSE: root mean squared error.
To evaluate the performance of the P2D-CNN model, prediction tests were conducted on three types of SOH degradation datasets, including those related to the positive electrode, the negative electrode, and the electrolyte.
These degradation data sets were generated by performing Latin hypercube sampling on relevant electrochemical parameters (normalized to the range of 0.5-1) and conducting finite element method calculations to obtain IC curves. For example, a positive electrode degradation dataset was created by separately sampling electrochemical parameters associated with the positive electrode and acquiring corresponding IC curve data. The sampled electrochemical parameters include both trained and untrained parameters, in order to closely simulate actual degradation conditions.
The parameter combinations that cause the degradation and the sampling range are shown in Table 3. When a specific degradation mode is set, the parameters of the other modes are fixed at 1. It is worth noting that, when generating the degradation model dataset, untrained electrochemical parameters were also incorporated to verify the model’s robustness. Moreover, the predicted internal resistance was highly consistent with the experimental data, as shown in Supplementary Figure 4, demonstrating that the predicted electrochemical parameters possess clear physical constraints.
The parameter combination of the degradation mode
| Degradation mode | Parameter | Sampling range | Classify |
| Positive electrode | Av pos | 0.5-1 | Untrained |
| Cs pos, max | 0.6-1 | Trained | |
| j 0,po s | 0.5-1 | Trained | |
| σ pos | 0.5-1 | Untrained | |
| D pos | 0.5-1 | Untrained | |
| C dl | 0.5-1 | Trained | |
| Negative electrode | Av neg | 0.5-1 | Trained |
| Cs neg, max | 0.6-1 | Trained | |
| j 0,neg | 0.5-1 | Trained | |
| σ neg | 0.5-1 | Untrained | |
| D neg | 0.5-1 | Untrained | |
| Electrolyte | σ ele | 0.5-1 | Trained |
| D ele | 0.5-1 | Trained |
Figure 6 shows the prediction results of the P2D-CNN model for SOH under different degradation types. Except for the SOH prediction under the positive electrode degradation mode, which yields an R2 below 0.9, the coefficients of determination for the other degradation modes all exceed 0.95.
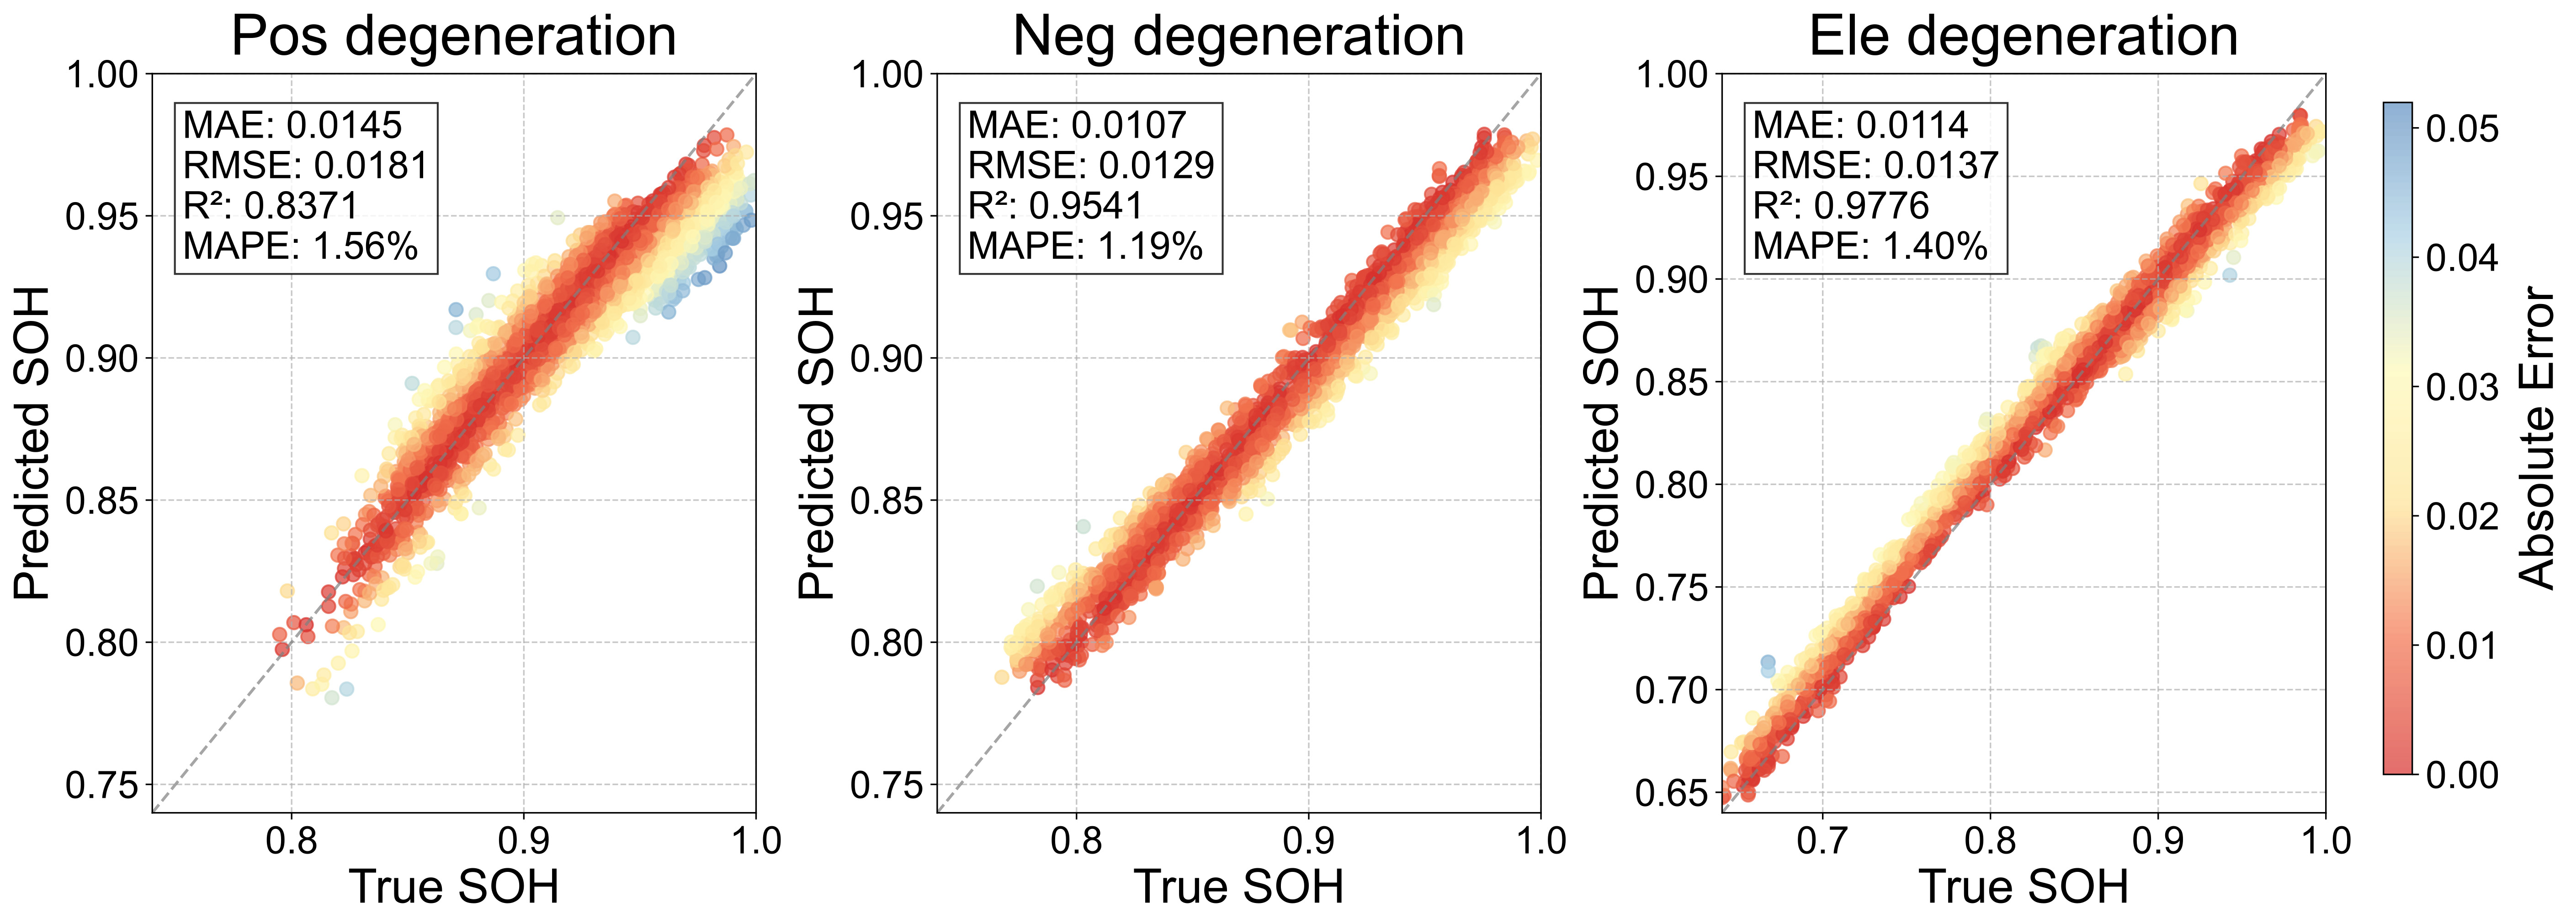
Figure 6. SOH and electrochemical parameter prediction under different degradation modes. SOH: State of health; MAPE: mean absolute percentage error; MSE: mean squared error; RMSE: root mean squared error.
The predicted results of the electrochemical parameters are shown in Figure 7. Except for the relatively poor prediction of the positive electrode parameters (Avpos, Cdl, j0,pos), the prediction accuracy for all other parameters is high, with R2 exceeding 0.9 and MAPE below 5%.
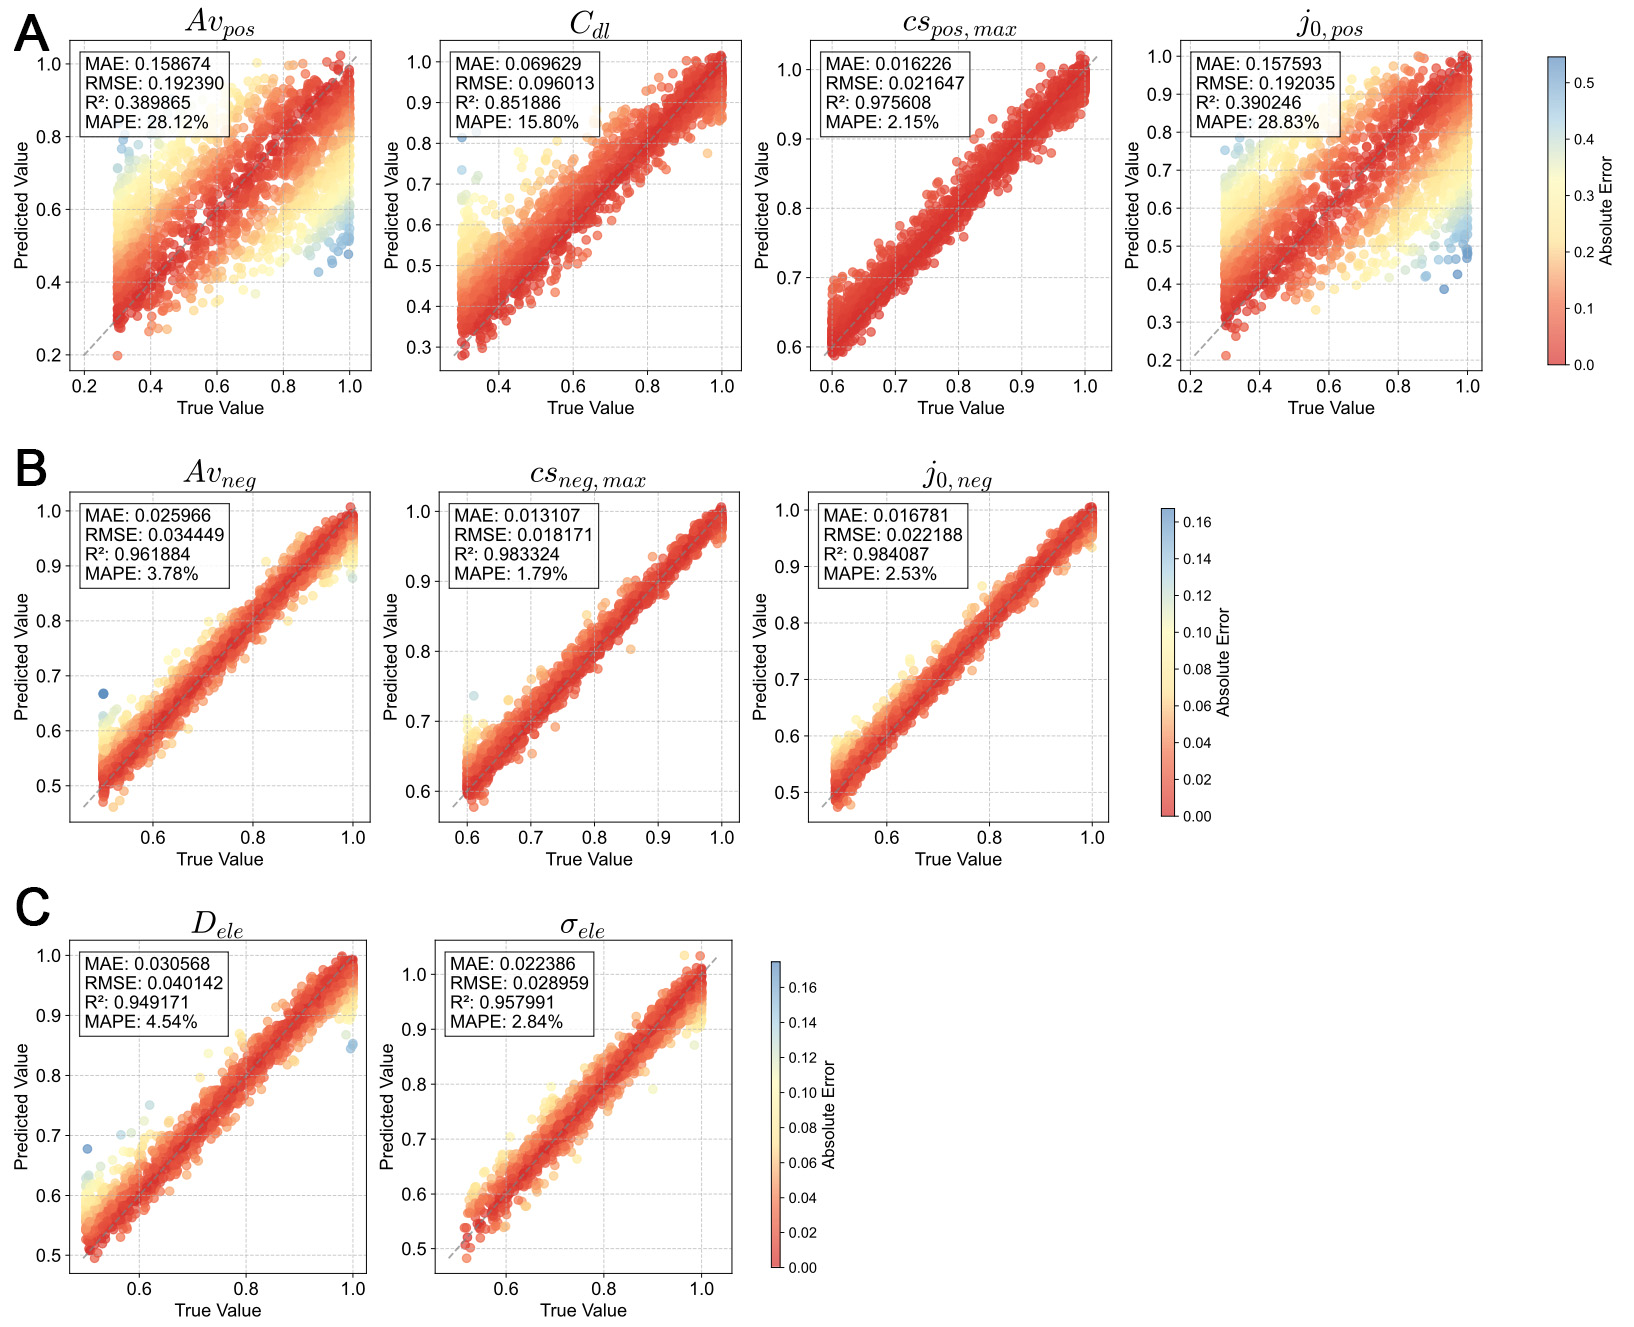
Figure 7. Electrochemical parameter identification for different degradation patterns. MAPE: Mean absolute percentage error; MSE: mean squared error; RMSE: root mean squared error.
The prediction accuracy for positive electrode degradation is somewhat limited. This can be attributed to the excessively high total Sobol indices of the positive electrode parameters, as shown in Figure 4B. The high total Sobol indices of the electrochemical parameters related to the positive electrode indicate that these parameters exert a strong coupled influence on the IC curve, making it difficult to accurately identify individual parameters from IC curves. Overall, the accuracy of P2D-CNN is sufficient for identifying SOH and the degradation trends of electrochemical performance parameters.
RESULTS AND DISCUSSION
Aging test and cell disassembly
The aging experiments involved conducting 10C cycles on hybrid supercapacitor cells at two different temperatures. Cells cycled at 25 and 45 °C were designated #A and #B, respectively. The aging test was stopped when the charge and discharge capacity approached 80% of the original capacity. To analyze the main mechanism of their capacity decline, the hybrid supercapacitor cells were disassembled, and the electrode materials were characterized through SEM, X-ray Diffraction (XRD), and X-ray Photoelectron Spectroscopy (XPS) analyses. The experimental procedure is illustrated in Figure 8.
Figure 8. Flowchart of the experiment. SEM: Scanning electron microscopy; XPS: X-ray photoelectron.
SEM characterization [Figure 9A] reveals that high-rate cycling markedly increases the surface roughness of the negative electrode, while the positive electrode material exhibits reduced sphericity with noticeable fragmentation. This suggests that both the positive and negative electrodes experience varying degrees of damage after high-rate cycling, and the interfacial side reactions are substantially intensified. In addition, the negative electrode particles underwent pulverization, and lithium precipitation occurred on the surface, as indicated by the surface particles in Figure 9A.
Figure 9. SEM images (A), XRD (B), and XPS (C) analyses of disassembled positive and negative electrodes from hybrid supercapacitors after 10C charge-discharge cycling at different temperatures. SEM: Scanning electron microscopy; XRD: X-ray diffraction; XPS: X-ray photoelectron; NCM: nickel cobalt manganese; AC: activated carbon; HC: hard carbon.
After cycling at different temperatures, all the negative electrode sheets exhibited a graphite peak at approximately 27° (as shown in Figure 9B), indicating that the amorphous structure of the negative electrode was partially disrupted. However, compared with the standard pattern, the crystal structure of the positive electrode showed no distinct changes.
From the XPS spectra shown in Figure 9C, characteristic peaks of Li2CO3 and ROCO2Li appear in the C1s spectrum, indicating that the electrolyte decomposed on the positive electrode surface and formed a cathode electrolyte interphase (CEI) film. This CEI substantially increases the interfacial charge transfer resistance, hinders rapid lithium-ion transport between the positive electrode and the electrolyte, which reduces the rate capability. By comparing the O1s spectra after cycling at 25 °C (#A) and 45 °C (#B), the peaks of oxygen-containing compounds related to electrolyte decomposition (such as those corresponding to C=O and C-O) are more intense at 45 °C. This demonstrates that high temperature accelerates the decomposition of the electrolyte on the positive electrode surface. Moreover, the peak intensities of LiF and LixPFγ in the F1s spectrum increase markedly, implying that the lithium salt LiPF6 in the electrolyte underwent decomposition during the cycling process. The decomposition of the lithium salt directly depletes the effective conductive components in the electrolyte, which reduces the overall ionic conductivity of the electrolyte.
SOH estimation and degradation analysis
Based on the experimental data acquired from the HSC aging cycle tests, charging curves were extracted and converted into IC curves. Subsequently, these IC curve data were input to the trained P2D-CNN model to obtain the predicted SOH and electrochemical parameters, as shown in Figure 10. By calibrating the charging curve of #A with early-cycle data, the P2D model could reproduce the electrochemical characteristics of #A; subsequently, the P2D-CNN model accurately predicted the SOH even under capacity regeneration or sharp capacity drops, as shown in Figure 10A. Over 13,898 cycles, the maximum absolute error of the predicted SOH was only 3.53%, the MAPE was 1.57%, and the R2 reached 0.9387, as presented in Table 4. Moreover, robustness tests [Supplementary Figures 5 and 6] show that, even in the presence of missing data, the prediction accuracy remains stable.
Figure 10. Results of evaluating the SOH and electrochemical parameters of HSC using the P2D-CNN method. (A) SOH evaluation of #A under different cycles; (B) The SOH prediction results of #B after transfer learning. CNN: Convolutional neural network; SOH: state of health; HSC: hybrid supercapacitors.
Statistical error of the prediction results
| Series | T | C-Rate | Cycle number | MSE | RMSE | MAPE (%) | R2 |
| #A | 25 °C | 10C | 13898 | 0.0063 | 0.0794 | 1.57 | 0.9387 |
| #B | 45 °C | 10C | 6851 | 0.0051 | 0.0714 | 1.64 | 0.9589 |
| #C | 10 °C | 10C | 8249 | 0.0028 | 0.0529 | 1.31 | 0.9686 |
| #D | 10 °C | 20C | 4754 | 0.0013 | 0.0361 | 1.24 | 0.9853 |
| #E | 25 °C | 20C | 9806 | 0.0039 | 0.0624 | 1.45 | 0.9447 |
| #F | 45 °C | 20C | 5210 | 0.0031 | 0.0557 | 1.41 | 0.9521 |
Using the IC curve to correct the P2D model is computationally expensive. Therefore, we employed transfer learning to complete the data prediction for #B. Fine-tuning is a transfer learning technique in which a pre-trained model is adjusted using a small amount of new data, enabling it to predict the SOH of new HSC. Here, to test the transfer capability of the P2D-CNN model, we fine-tuned the trained model of #A using the initial 10% cycle data of #B. The fine-tuning configuration of the P2D-CNN model can be seen in Supplementary Figure 7 and Supplementary Table 2.
A comparison of the predicted SOH using the fine-tuned model, the model before fine-tuning, and a pure CNN trained with only 10% of the data is shown in Figure 10B. The model trained solely with a CNN exhibits poor prediction accuracy, and after 3,000 cycles, the prediction results become unreliable. The prediction results of the model before fine-tuning deviated substantially from the actual values overall, although the degradation trend matched closely. This indicates that the P2D-CNN model can directly capture the evolution trends of other HSC cells, although recalibration is needed. After initial calibration with a small amount of data, the prediction accuracy improved substantially. The maximum absolute error of extreme outliers is only 7.13%, while the MAPE is only 1.64%, and the coefficient of determination reaches 0.9589, as shown in Table 4.
We also added four sets of cycling data at different temperatures and charging rates to verify the generalization performance of the transfer learning algorithm, as shown in Table 4. The SOH prediction results and the nine-parameter prediction results are shown in Supplementary Figures 8 and 9. The SOH prediction accuracy remains high, with MAPE below 2% and R2 exceeding 0.9.
Figure 11 shows the results of identifying electrochemical parameters using P2D-CNN. Although there is some fluctuation in the data points, the trends are evident throughout the cycling process. The degradation trends of the electrochemical parameters of #A and #B are similar. Based on the coefficients of determination, the relatively strong correlations include Avpos, Cdl, Dele, Cspos, max, Csneg, max, j0, neg. Among them, Avpos, Cdl, Dele, and Csneg, max exhibit downward trends, which are the primary causes of SOH degradation.
Figure 11. The evolution process of electrochemical parameters over the course of the cycle.
From the by-products shown in Figure 9C, it can be inferred that a CEI formed on the positive electrode surface. This film covers the surface of the activated carbon particles and blocks their pores, reducing the effective contact area between the activated carbon and the electrolyte. Additionally, during the cycling process, the activated carbon particles may aggregate due to stress or interface reactions, further reducing the available specific surface area, which reduces the capacitance contribution. This accounts for the observed decrease in Cdl.
The cause of the decrease in Csneg, max can be clearly identified. As shown in Figure 9A, after aging cycles, the roughness of the negative electrodes increased and lithium dendrites formed; meanwhile, XRD characterization [Figure 9B] reveals the formation of graphite. These processes reduce the effective sites for lithium-ion insertion, consequently decreasing the maximum lithium insertion capacity.
Similarly, the decrease in j0, neg is also attributed to the decomposition of the electrolyte, the accumulation of reaction by-products, and the degradation of the surface/phase structure of the negative electrode active material, such as SEI film coverage on the material surface and increased internal defects. All of these factors reduce the electrochemical reaction activity on the negative electrode surface, ultimately leading to a reduction in the exchange current density j0,neg.
The electrochemical parameters related to the positive electrode, Avpos and Cspos, max, exhibit opposite trends. Referring to Figure 9, during the cycling process of the positive electrode material, CEI film formation and particle evolution reduce the active specific surface area. However, the activation of the bulk structure, the generation of defects, and the promotion of lithium ion transport by the CEI film all contribute to an increase in the overall lithium insertion sites and efficiency, ultimately resulting in an increase in Cspos,max. This interplay between surface loss and bulk-interfacial gain accounts for the contrasting trends of these two parameters. Under high-rate operation, HSC performance is governed by interfacial charge transfer and ion transport, so the rate-limiting effect from reduced active surface area far outweighs the lithium-storage gain from bulk activation, leaving newly formed lithium insertion sites underutilized and resulting in overall capacity fade despite the increase in Cspos,max.
The primary difference in the electrochemical degradation trend between #A and #B lies in the electrolyte performance. This is evident from the changing trends of Dele and σele parameters in Figure 11. Clearly, the electrolyte performance of #B deteriorates more rapidly, indicating that the elevated temperature accelerates the rate of side reactions. This is supported by Figure 9A, which shows a greater number of lithium dendrite crystallization sites on the negative electrode of #B. The formation of dendrites substantially consumes the lithium concentration in the electrolyte, which degrades the electrochemical performance of the electrolyte.
Overall, the P2D-CNN model demonstrates strong transfer learning capability and can accurately predict SOH and electrochemical parameters with only a relatively small amount of data. The refined model does not produce uniform degradation pattern evaluations despite using a shared dataset; it can still distinguish differences in degradation patterns across different scenarios.
CONCLUSIONS
A hybrid framework combining a physical P2D model and a convolutional neural network was developed in this study to enable online SOH prediction and real-time electrochemical degradation evaluation of hybrid supercapacitors using IC curves as the input. The main contributions and discoveries are as follows.
(1) Only a small portion of early charging profiles is required to train the P2D-CNN model, enabling full-cycle SOH prediction for hybrid supercapacitors. Fine-tuning the pre-trained model with limited transferred data achieves effective transfer learning with high accuracy, mitigating data scarcity for unseen datasets.
(2) The P2D-CNN model achieved strong prediction accuracy: for #A, SOH prediction yielded an R2 of 0.9387 and a MAPE of 1.57% across 13,898 cycles; for fine-tuned #B, R2 reached 0.9589 and the MAPE was 1.64%, enabling accurate tracking of electrochemical parameter degradation trends.
(3) High temperatures accelerate the degradation of HSC. Under 10C cycling, Cell #B cycled at 45 °C exhibited faster electrolyte degradation than Cell #A cycled at 25 °C. Characterizations verify excessive lithium dendrite formation on the negative electrode and aggravated accumulation of electrolyte decomposition byproducts in Cell #B.
(4) To uncover the intrinsic degradation pathways, disassembled HSC samples were analyzed through SEM, XRD, and XPS measurements. The results reveal three critical failure modes: CEI layer buildup on the cathode elevates interfacial impedance, lithium dendrite proliferation on the anode reduces effective Li+ intercalation sites, and chemical decomposition of LiPF6 within the electrolyte degrades ionic conduction performance.
The P2D-CNN framework achieves non-destructive, accurate online SOH prediction and mechanistic degradation analysis for hybrid supercapacitors. It provides a practical tool for HSC design optimization, health monitoring, and maintenance strategy development. Future research could integrate Physics-Informed Neural Networks (PINN) into the existing framework to further improve prediction accuracy.
DECLARATIONS
Authors’ contributions
Conceptualization: Wu, X.; Long, B.; Liu, J.; Zhang, J.
Methodology, data curation, formal analysis, investigation: Liu, J.; Zhang, J.; Lv, S.; Yin, X.; Wu, X.; Shu, C.; Tang, W.; Li, J.
Writing - original draft: Liu, J.; Zhang, J.
Writing - review & editing: Liu, J.; Zhang, J.; Wu, X.; Long, B.
Visualization: Liu, J.; Zhang, J.; Lv, S.; Yin, X.; Wu, X.; Shu, C.; Tang, W.; Li, J.
Resources, supervision: Wu, X.; Long, B.; Liu, J.; Zhang, J.
Project Administration, Funding Acquisition: Wu, X.; Long, B.; Liu, J.; Zhang, J.
Availability of data and materials
The original contributions presented in this study are included in the article and Supplementary Materials. Further inquiries can be directed to the corresponding authors.
AI and AI-assisted tools statement
During the preparation of this manuscript, the AI tool OpenAI (version GPT 5.5, released 2026-04-24) was used solely for language editing. The tool did not influence the study design, data collection, analysis, interpretation, or the scientific content of the work. All authors take full responsibility for the accuracy, integrity, and final content of the manuscript.
Financial support and sponsorship
This work is supported by the National Key R & D Program of China (2021YFB2400400).
Conflicts of interest
Wu, X. and Tang, W. are Editorial Board Members of the journal Energy Materials. Wu, X. and Tang, W. were not involved in any steps of the editorial processing, notably including reviewers’ selection, manuscript handling, and decision making. Liu, J.; Zhang, J.; Wu, X.; Lv, S.; Yin, X.; Wu, X.; Li, J.; Long, B. are affiliated with Hunan Province Yinfeng New Energy Co., Ltd. The other authors declare that there are no conflicts of interest.
Ethical approval and consent to participate
Not applicable.
Consent for publication
Not applicable.
Copyright
© The Author(s) 2026.
Supplementary Materials
REFERENCES
1. Zhao, S.; Guo, Z.; Yan, K.; et al. Towards high-energy-density lithium-ion batteries: strategies for developing high-capacity lithium-rich cathode materials. Energy. Storage. Mater. 2021, 34, 716-34.
2. Elmahallawy, M.; Elfouly, T.; Alouani, A.; Massoud, A. M. A comprehensive review of lithium-ion batteries modeling, and state of health and remaining useful lifetime prediction. IEEE. Access. 2022, 10, 119040-70.
3. Zhao, J.; Burke, A. F. Electric vehicle batteries: status and perspectives of data-driven diagnosis and prognosis. Batteries 2022, 8, 142.
4. Wu, X.; Lv, S.; Li, J.; et al. Enhanced energy density and fast-charging ability via directional particle configuration. J. Energy. Chem. 2024, 90, 152-64.
5. Sonika; Singh, N. Hybrid MXenes for supercapacitors: advances, mechanisms, and outlook. Mater. Today. Phys. 2025, 59, 101947.
6. Zhang, B.; Liu, W.; Tian, Y.; et al. Optimization strategies for high performance zinc-ion hybrid supercapacitors: advances in materials, interfaces and devices. Energy. Storage. Mater. 2025, 80, 104449.
7. Sahani, S.; Mahajan, H.; Han, S. S. Unveiling the hybrid era: advancement in electrode materials for the high-performance supercapacitor: a comprehensive review. J. Energy. Storage. 2024, 90, 111808.
8. Su, L.; Xu, Y.; Dong, Z. State‐of‐health estimation of lithium‐ion batteries: a comprehensive literature review from cell to pack levels. Energy. Convers. Econ. 2024, 5, 224-42.
9. Su, L.; Wu, M.; Li, Z.; Zhang, J. Cycle life prediction of lithium-ion batteries based on data-driven methods. eTransportation 2021, 10, 100137.
11. Zhao, J.; Zhu, Y.; Zhang, B.; et al. Review of state estimation and remaining useful life prediction methods for lithium-ion batteries. Sustainability 2023, 15, 5014.
12. Sun, Y.; Xiong, R.; Wang, P.; Li, H.; Sun, F. A deep learning approach for enhanced degradation diagnostics of NMC lithium-ion batteries via impedance spectra. J. Energy. Chem. 2025, 107, 894-907.
13. Lin, C.; Wu, L.; Tuo, X.; et al. A lightweight two-stage physics-informed neural network for SOH estimation of lithium-ion batteries with different chemistries. J. Energy. Chem. 2025, 105, 261-79.
14. Li, Y.; Li, L.; Li, L.; et al. Research on hybrid data-driven method for predicting the remaining useful life of lithium-ion batteries. Comput. Phys. Commun. 2025, 309, 109500.
15. Wei, Z.; Wu, M.; Wu, J.; et al. Localized feature selection augmented dual-stream fusion network for state of health estimation of lithium-ion batteries. J. Energy. Chem. 2025, 109, 879-92.
16. Wang, F.; Zhai, Z.; Zhao, Z.; Di, Y.; Chen, X. Physics-informed neural network for lithium-ion battery degradation stable modeling and prognosis. Nat. Commun. 2024, 15, 4332.
17. Wu, J.; Sun, Z.; Li, D.; et al. Efficient estimating and clustering lithium-ion batteries with a deep-learning approach. Commun. Eng. 2025, 4, 151.
18. Samanta, A.; Chowdhuri, S.; Williamson, S. S. Machine learning-based data-driven fault detection/diagnosis of lithium-ion battery: a critical review. Electronics 2021, 10, 1309.
19. Zhao, J.; Zhu, Y.; Zhang, B.; et al. Method of predicting SOH and RUL of lithium-ion battery based on the combination of LSTM and GPR. Sustainability 2022, 14, 11865.
20. Li, S.; Yang, S.; Jiang, Z.; Jiang, W.; Zhu, Z.; Ma, Y. An online state of charge estimation method: support vector machine battery model fusing a filtering algorithm. Electr. Power. Syst. Res. 2026, 253, 112530.
21. Qin, M.; Zhu, J.; Li, K.; Li, Q.; Liu, Y.; Su, T. Dynamic and uncertainty-aware isomorphic knowledge distillation for state of health estimation of lithium-ion batteries. J. Power. Sources. 2026, 678, 240066.
22. Peng, S.; Wang, Y.; Tang, A.; Jiang, Y.; Kan, J.; Pecht, M. State of health estimation joint improved grey wolf optimization algorithm and LSTM using partial discharging health features for lithium-ion batteries. Energy 2025, 315, 134293.
23. Ding, S.; Li, Y.; Dai, H.; Wang, L.; He, X. Accurate model parameter identification to boost precise aging prediction of lithium‐ion batteries: a review. Adv. Energy. Mater. 2023, 13, 2301452.
24. Asiri, M.; Kedhim, M.; Jain, V.; et al. Impact of temperature and state-of-charge on long-term storage degradation in lithium-ion batteries: an integrated P2D-based degradation analysis. RSC. Adv. 2025, 15, 22576-86.
25. Liu, B.; Tang, X.; Gao, F. Joint estimation of battery state-of-charge and state-of-health based on a simplified pseudo-two-dimensional model. Electrochim. Acta. 2020, 344, 136098.
26. An, Y.; Feng, F.; Luo, H.; et al. Fusion of local and global feature-based explainable diagnostic method for lithium-ion battery degradation modes. IEEE. Trans. Transp. Electrific. 2025, 11, 8353-64.
27. Kadiwala, S.; Savsaviya, P.; Pandey, S. V.; et al. Decoding degradation: The synergy of partial differential equations and advanced predictive models for lithium-ion battery. J. Power. Sources. 2025, 627, 235771.
28. Enrico, D. S.; Vanessa, P.; Massimiliano, L.; Antonello, R. Degradation mechanisms and differential curve modeling for non-invasive diagnostics of lithium cells: an overview. Renew. Sustain. Energy. Rev. 2025, 211, 115349.
29. Li, R.; Kirkaldy, N. D.; Oehler, F. F.; Marinescu, M.; Offer, G. J.; O’kane, S. E. J. The importance of degradation mode analysis in parameterising lifetime prediction models of lithium-ion battery degradation. Nat. Commun. 2025, 16, 2776.
30. Almunyif, A. A.; Mumtaz, S.; Afzal, A. M. Synergistic Ni(OH)2@Li4Ti5O12@B/N-doped graphene architecture: pioneering high-energy hybrid supercapacitors with superior electrocatalytic performance. Inorg. Chem. Commun. 2025, 181, 115243.
31. Yang, Y.; Chen, L.; Yang, L.; Du, X.; Yang, Y. Capacity fade characteristics of lithium iron phosphate cell during dynamic cycle. Energy 2020, 206, 118155.
32. Yvenat, M.; Chavillon, B.; Mayousse, E.; et al. Study of the influence of the formation protocol on the SEI layer formed at the graphite electrode surface of a non-aqueous potassium-ion hybrid supercapacitor (KIC) through STEM and XPS analyses. Sustain. Energy. Fuels. 2023, 7, 4150-9.
33. Qiu, F.; Wang, X.; Shi, H.; et al. Synergistic optimization of NCM9055/AC composites enabling superior performance in hybrid battery-supercapacitors. Energy. Mater. 2026, 6.
34. Hu, D.; Su, Y.; Chen, L.; et al. The mechanism of side reaction induced capacity fading of Ni-rich cathode materials for lithium ion batteries. J. Energy. Chem. 2021, 58, 1-8.
35. Li, X.; Li, Z.; Zhang, Y.; et al. Stable hexaazatrinaphthylene-based covalent organic framework as high-capacity electrodes for aqueous hybrid supercapacitors. Energy. Mater. 2025, 5, 500036.
Cite This Article
How to Cite
Download Citation
Export Citation File:
Type of Import
Tips on Downloading Citation
Citation Manager File Format
Type of Import
Direct Import: When the Direct Import option is selected (the default state), a dialogue box will give you the option to Save or Open the downloaded citation data. Choosing Open will either launch your citation manager or give you a choice of applications with which to use the metadata. The Save option saves the file locally for later use.
Indirect Import: When the Indirect Import option is selected, the metadata is displayed and may be copied and pasted as needed.
About This Article
Copyright

Data & Comments
Data
0


Comments
Comments must be written in English. Spam, offensive content, impersonation, and private information will not be permitted. If any comment is reported and identified as inappropriate content by OAE staff, the comment will be removed without notice. If you have any queries or need any help, please contact us at [email protected].