
fig2
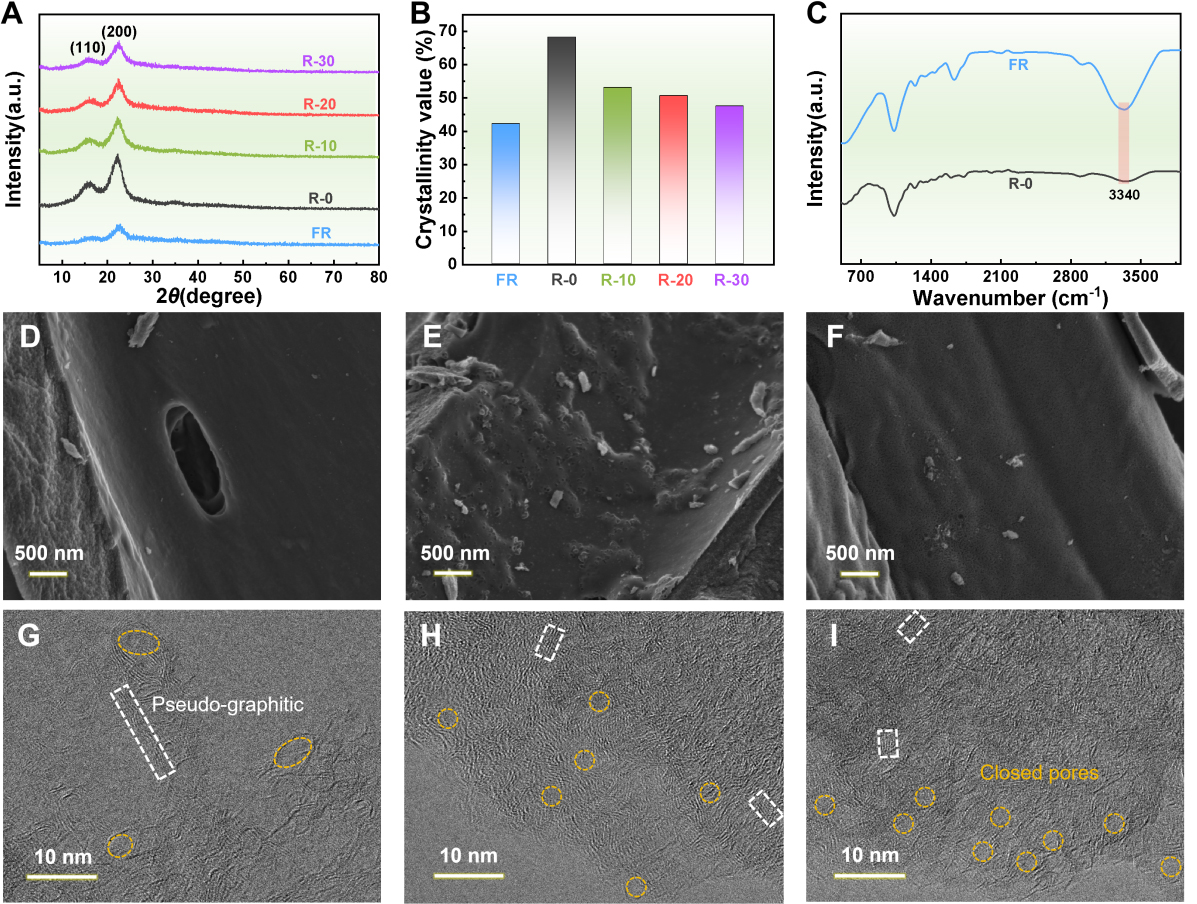
Figure 2. XRD patterns (A) and corresponding cellulose crystallinity values (B) for FR and R-x. FTIR spectra (C) of FR and R-0. SEM images of R-HC-0 (D), FR-HC (E), and R-HC-20 (F). HRTEM images of R-HC-0 (G), FR-HC (H), and R-HC-20 (I). XRD: X-ray diffraction; FTIR: Fourier transform infrared spectroscopy; HRTEM: high-resolution transmission electron microscopy; FR: fresh reeds; SEM: scanning electron microscopy.