
fig5
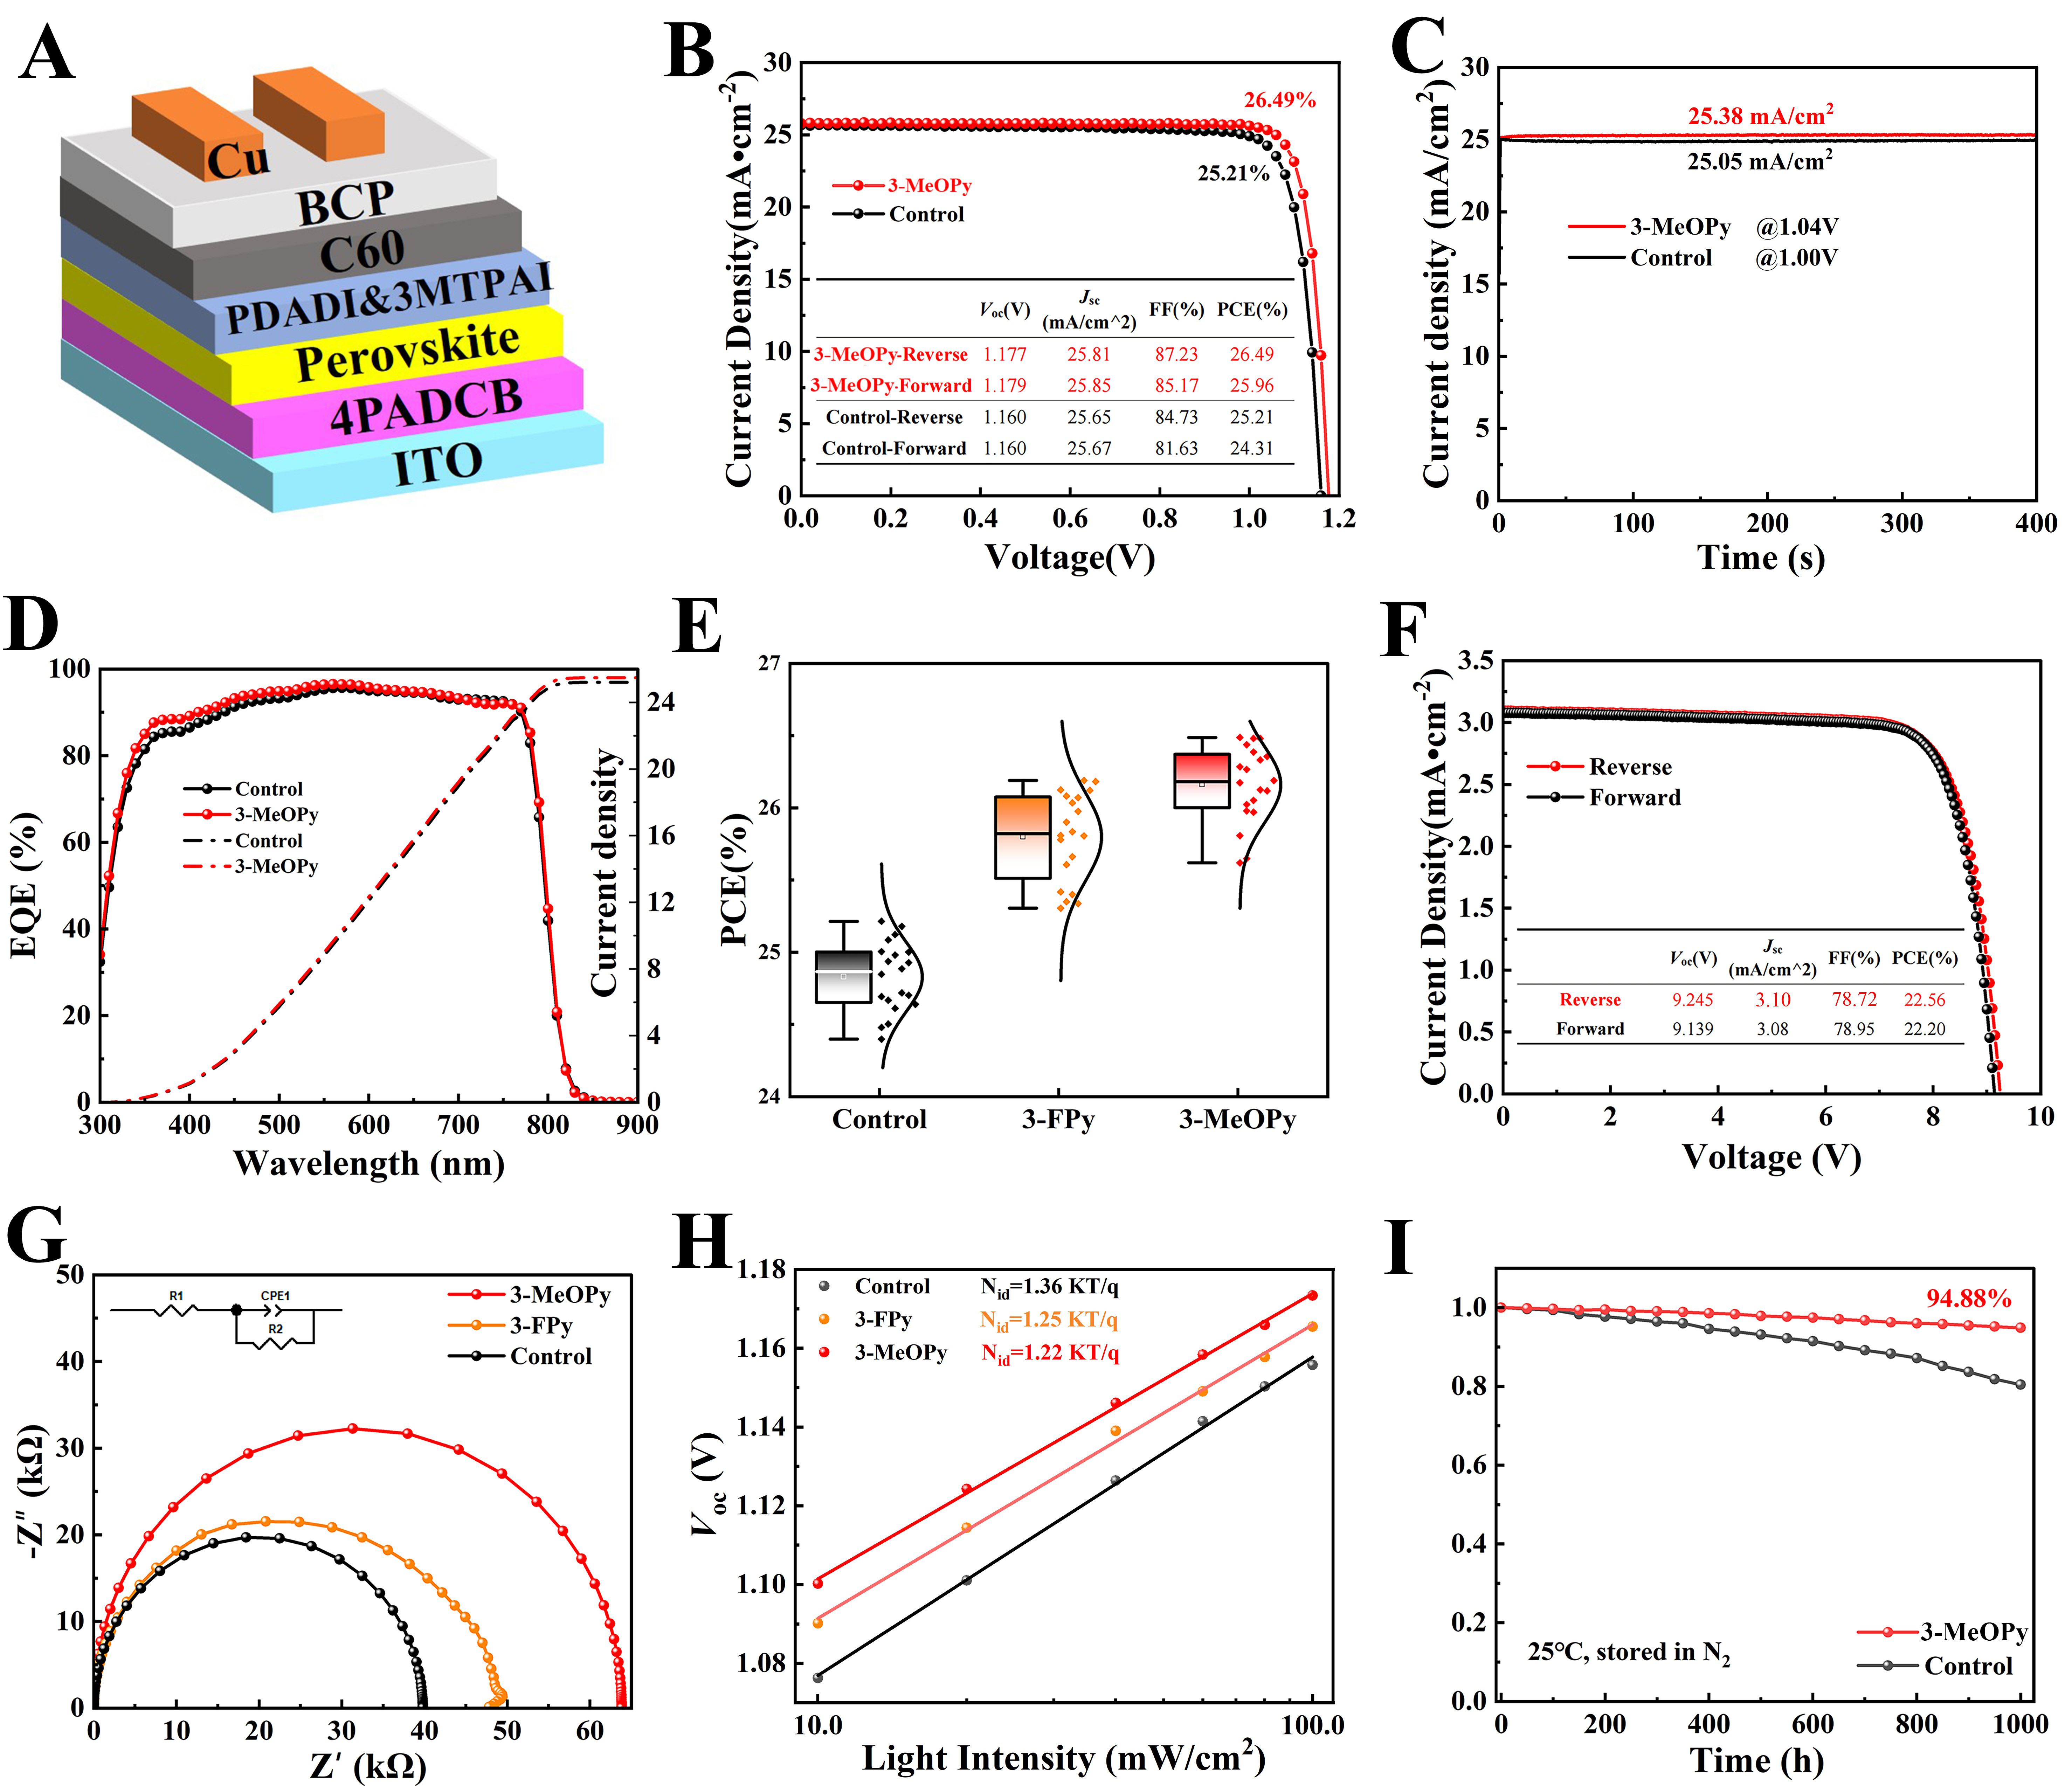
Figure 5. (A) Schematic of the inverted device architecture. (B) J-V curves of the champion devices for control and 3-MeOPy-treated SAMs; (C) SPO tracking at the maximum power point for the champion devices over 400 s; (D) EQE spectra and corresponding integrated Jsc; (E) Box plots showing the PCE distributions of different conditions based on reverse-scan measurements from 20 independent devices for each condition. The center line, box, and whiskers represent the median, interquartile range (25th-75th percentiles), and data within 1.5× the interquartile range, respectively. (F) J-V curve of the champion mini-module with an aperture area of 12.87 cm2; (G) EIS Nyquist plots, with the equivalent circuit shown in the inset; (H) Voc as a function of light intensity, with the fitted values,