

fig3
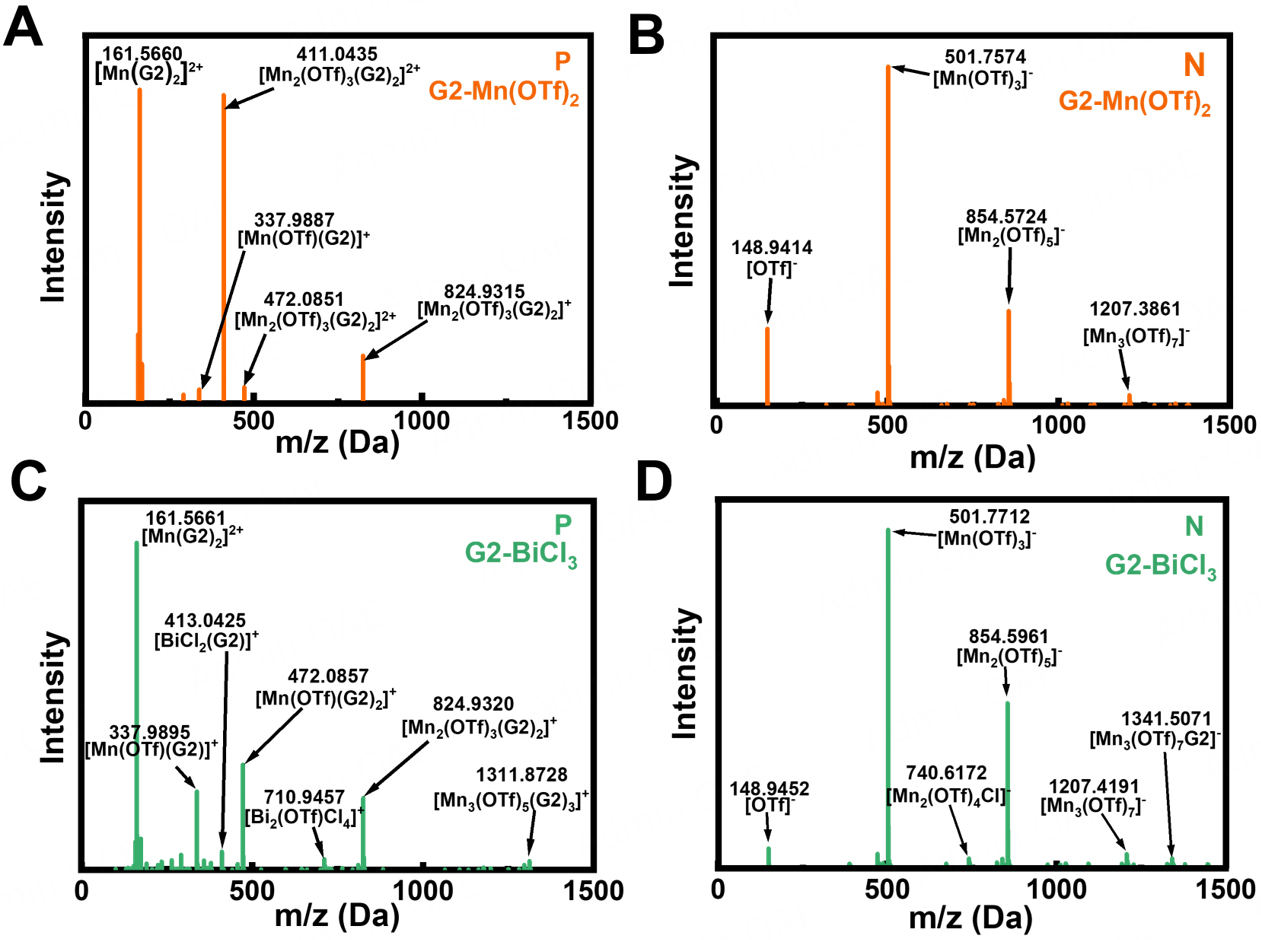
Figure 3. ESI-MS analysis of the different electrolytes. High-resolution ESI-MS spectra obtained in (A and B): G2-Mn(OTf)2 electrolyte; (C and D): G2-BiCl3 electrolyte. P/N denotes positive/negative ion mode, respectively.
Figure 3. ESI-MS analysis of the different electrolytes. High-resolution ESI-MS spectra obtained in (A and B): G2-Mn(OTf)2 electrolyte; (C and D): G2-BiCl3 electrolyte. P/N denotes positive/negative ion mode, respectively.


All published articles are preserved here permanently:
https://www.portico.org/publishers/oae/


