

fig2
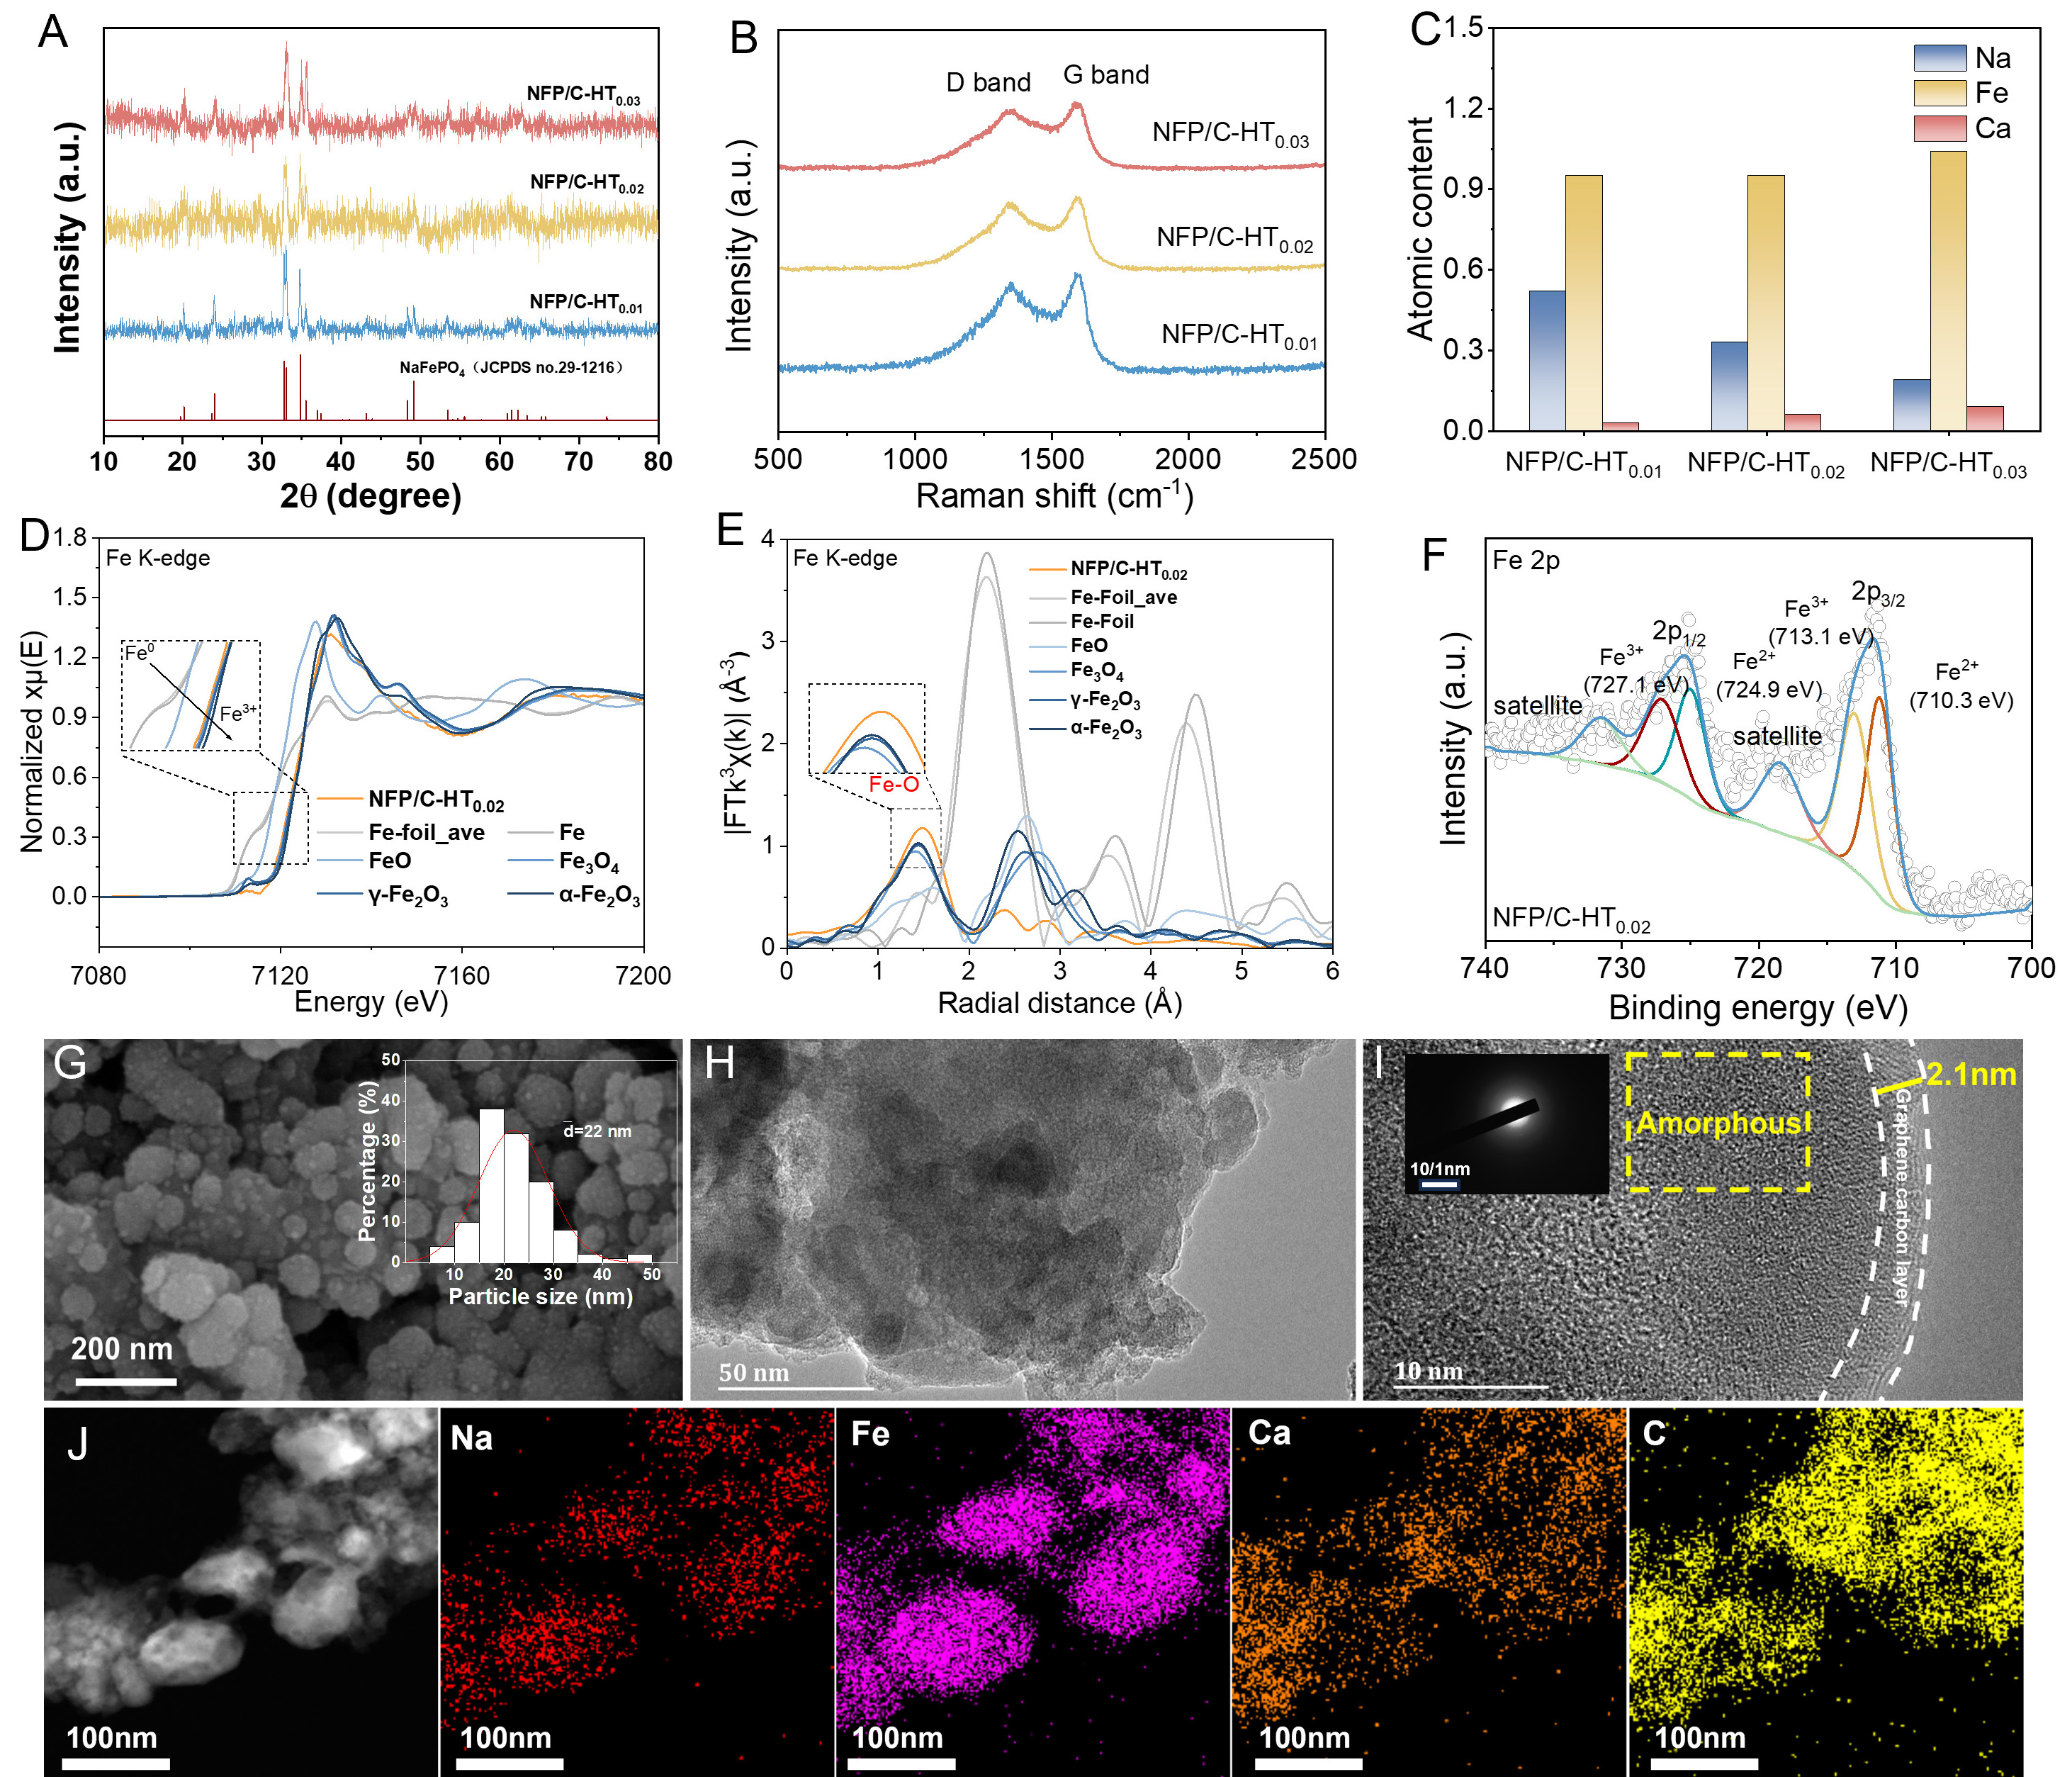
Figure 2. Structural characterizations: (A) XRD patterns of NFP/C-HT0.01, NFP/C-HT0.02, and NFP/C-HT0.03 samples; (B) Raman spectra of NFP/C-HT0.01, NFP/C-HT0.02, and NFP/C-HT0.03 samples; (C) ICP results for NFP/C-HT0.01, NFP/C-HT0.02, and NFP/C-HT0.03 samples; (D) XANES spectra of NFP/C-HT0.02; (E) normalized Fe EXAFS spectra of NFP/C-HT0.02; (F) Fe 2p spectra of NFP/C-HT0.02; (G-J) SEM, TEM, HRTEM, and EDS images of NFP/C-HT0.02 (inset shows the particle size distribution histogram).





