


fig4
From: Superior photoelectrocatalytic performance of Mo-doped γ-Fe2O3 catalyst for degrading tetracycline
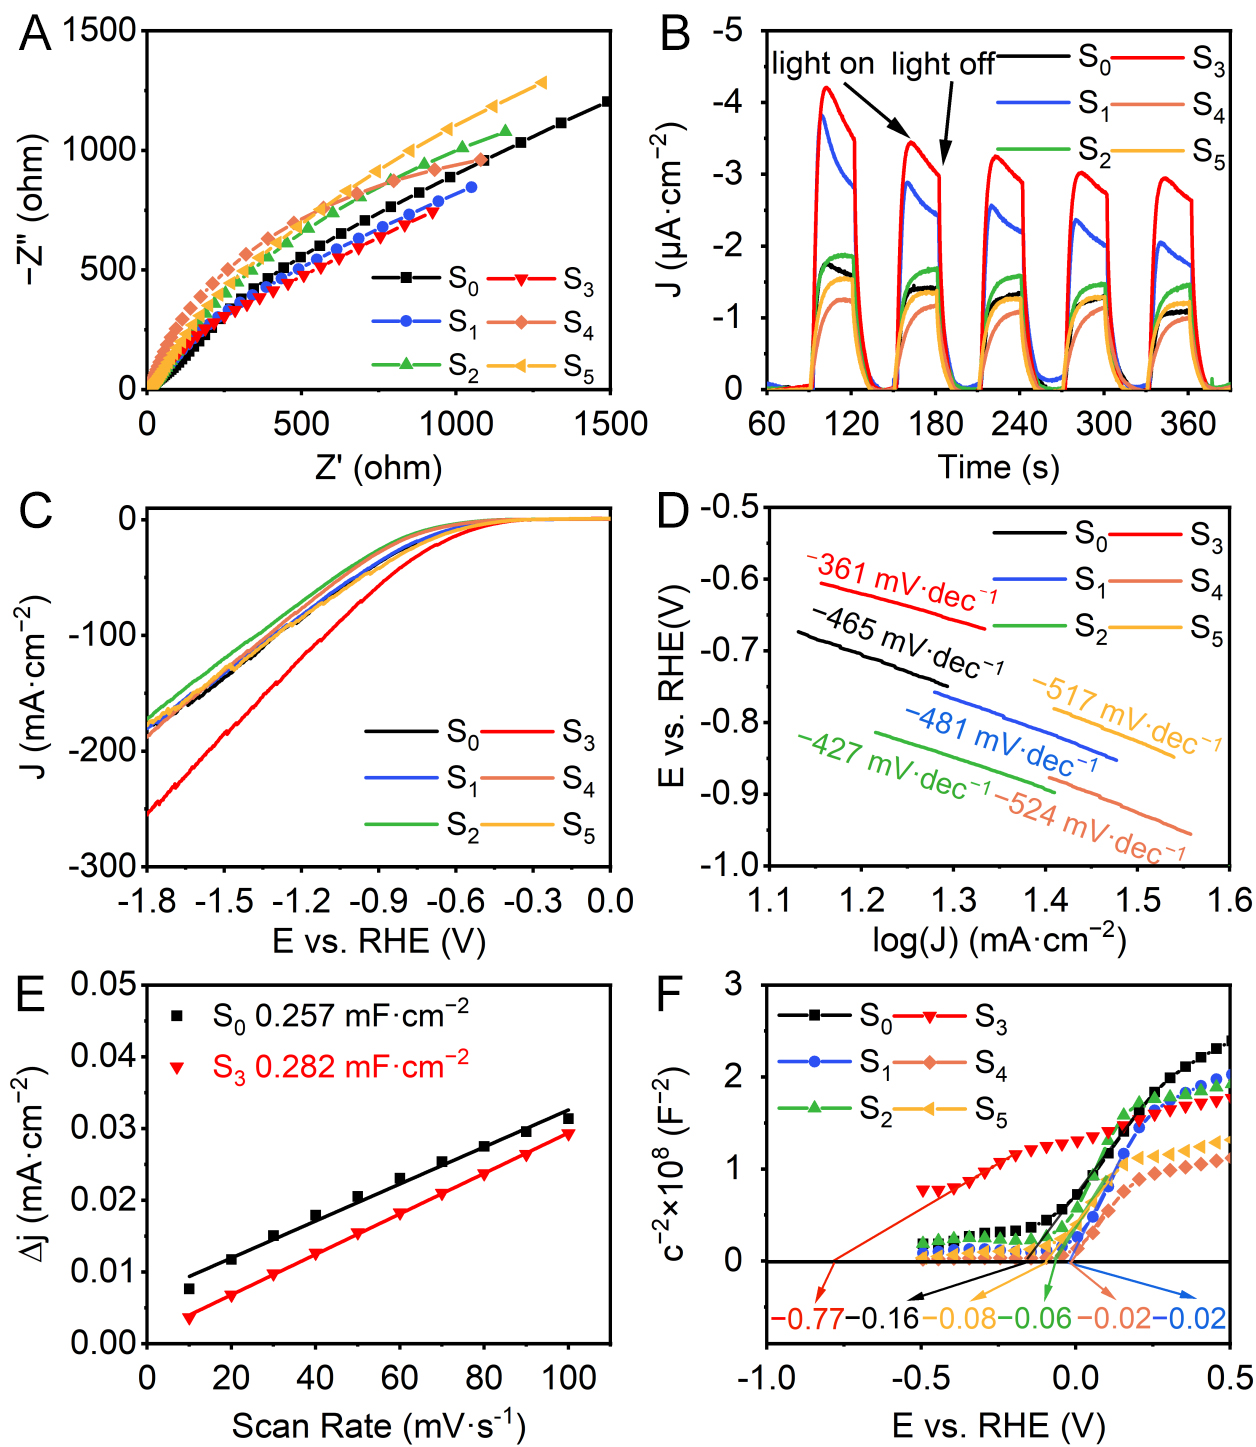
Figure 4. (A) Nyquist plots under AM 1.5 G illumination, (B) photocurrent responses, (C) LSV curves under AM 1.5 G illumination, (D) Tafel plots, (E) Cdl, (F) Mott-Schottky plots of S0, S1, S2, S3, S4 and S5. LSV: Linear sweep voltammogram; AM 1.5 G: air mass 1.5 global solar spectrum; RHE: reversible hydrogen electrode.


