


fig1
From: Superior photoelectrocatalytic performance of Mo-doped γ-Fe2O3 catalyst for degrading tetracycline
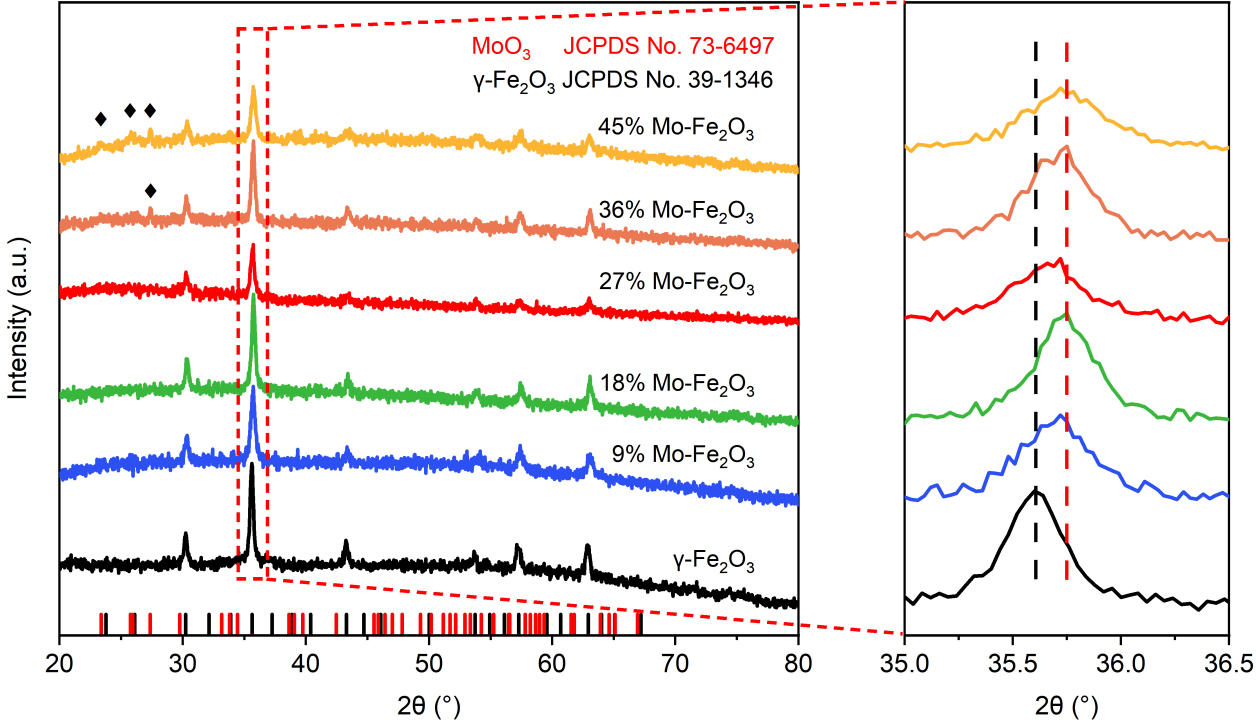
Figure 1. XRD patterns of γ-Fe2O3, 9% Mo-Fe2O3, 18% Mo-Fe2O3, 27% Mo-Fe2O3, 36% Mo-Fe2O3, and 45% Mo-Fe2O3, respectively. In the panel, the diffraction peaks (♦) are assigned to the α-MoO3 phase, and the short vertical lines below the XRD patterns mark all Bragg positions of γ-Fe2O3 (black) and MoO3 (red). XRD patterns on the right are the magnified of the (311) peak of the γ-Fe2O3 phase in the dashed box. XRD: X-ray diffraction.


