

fig2
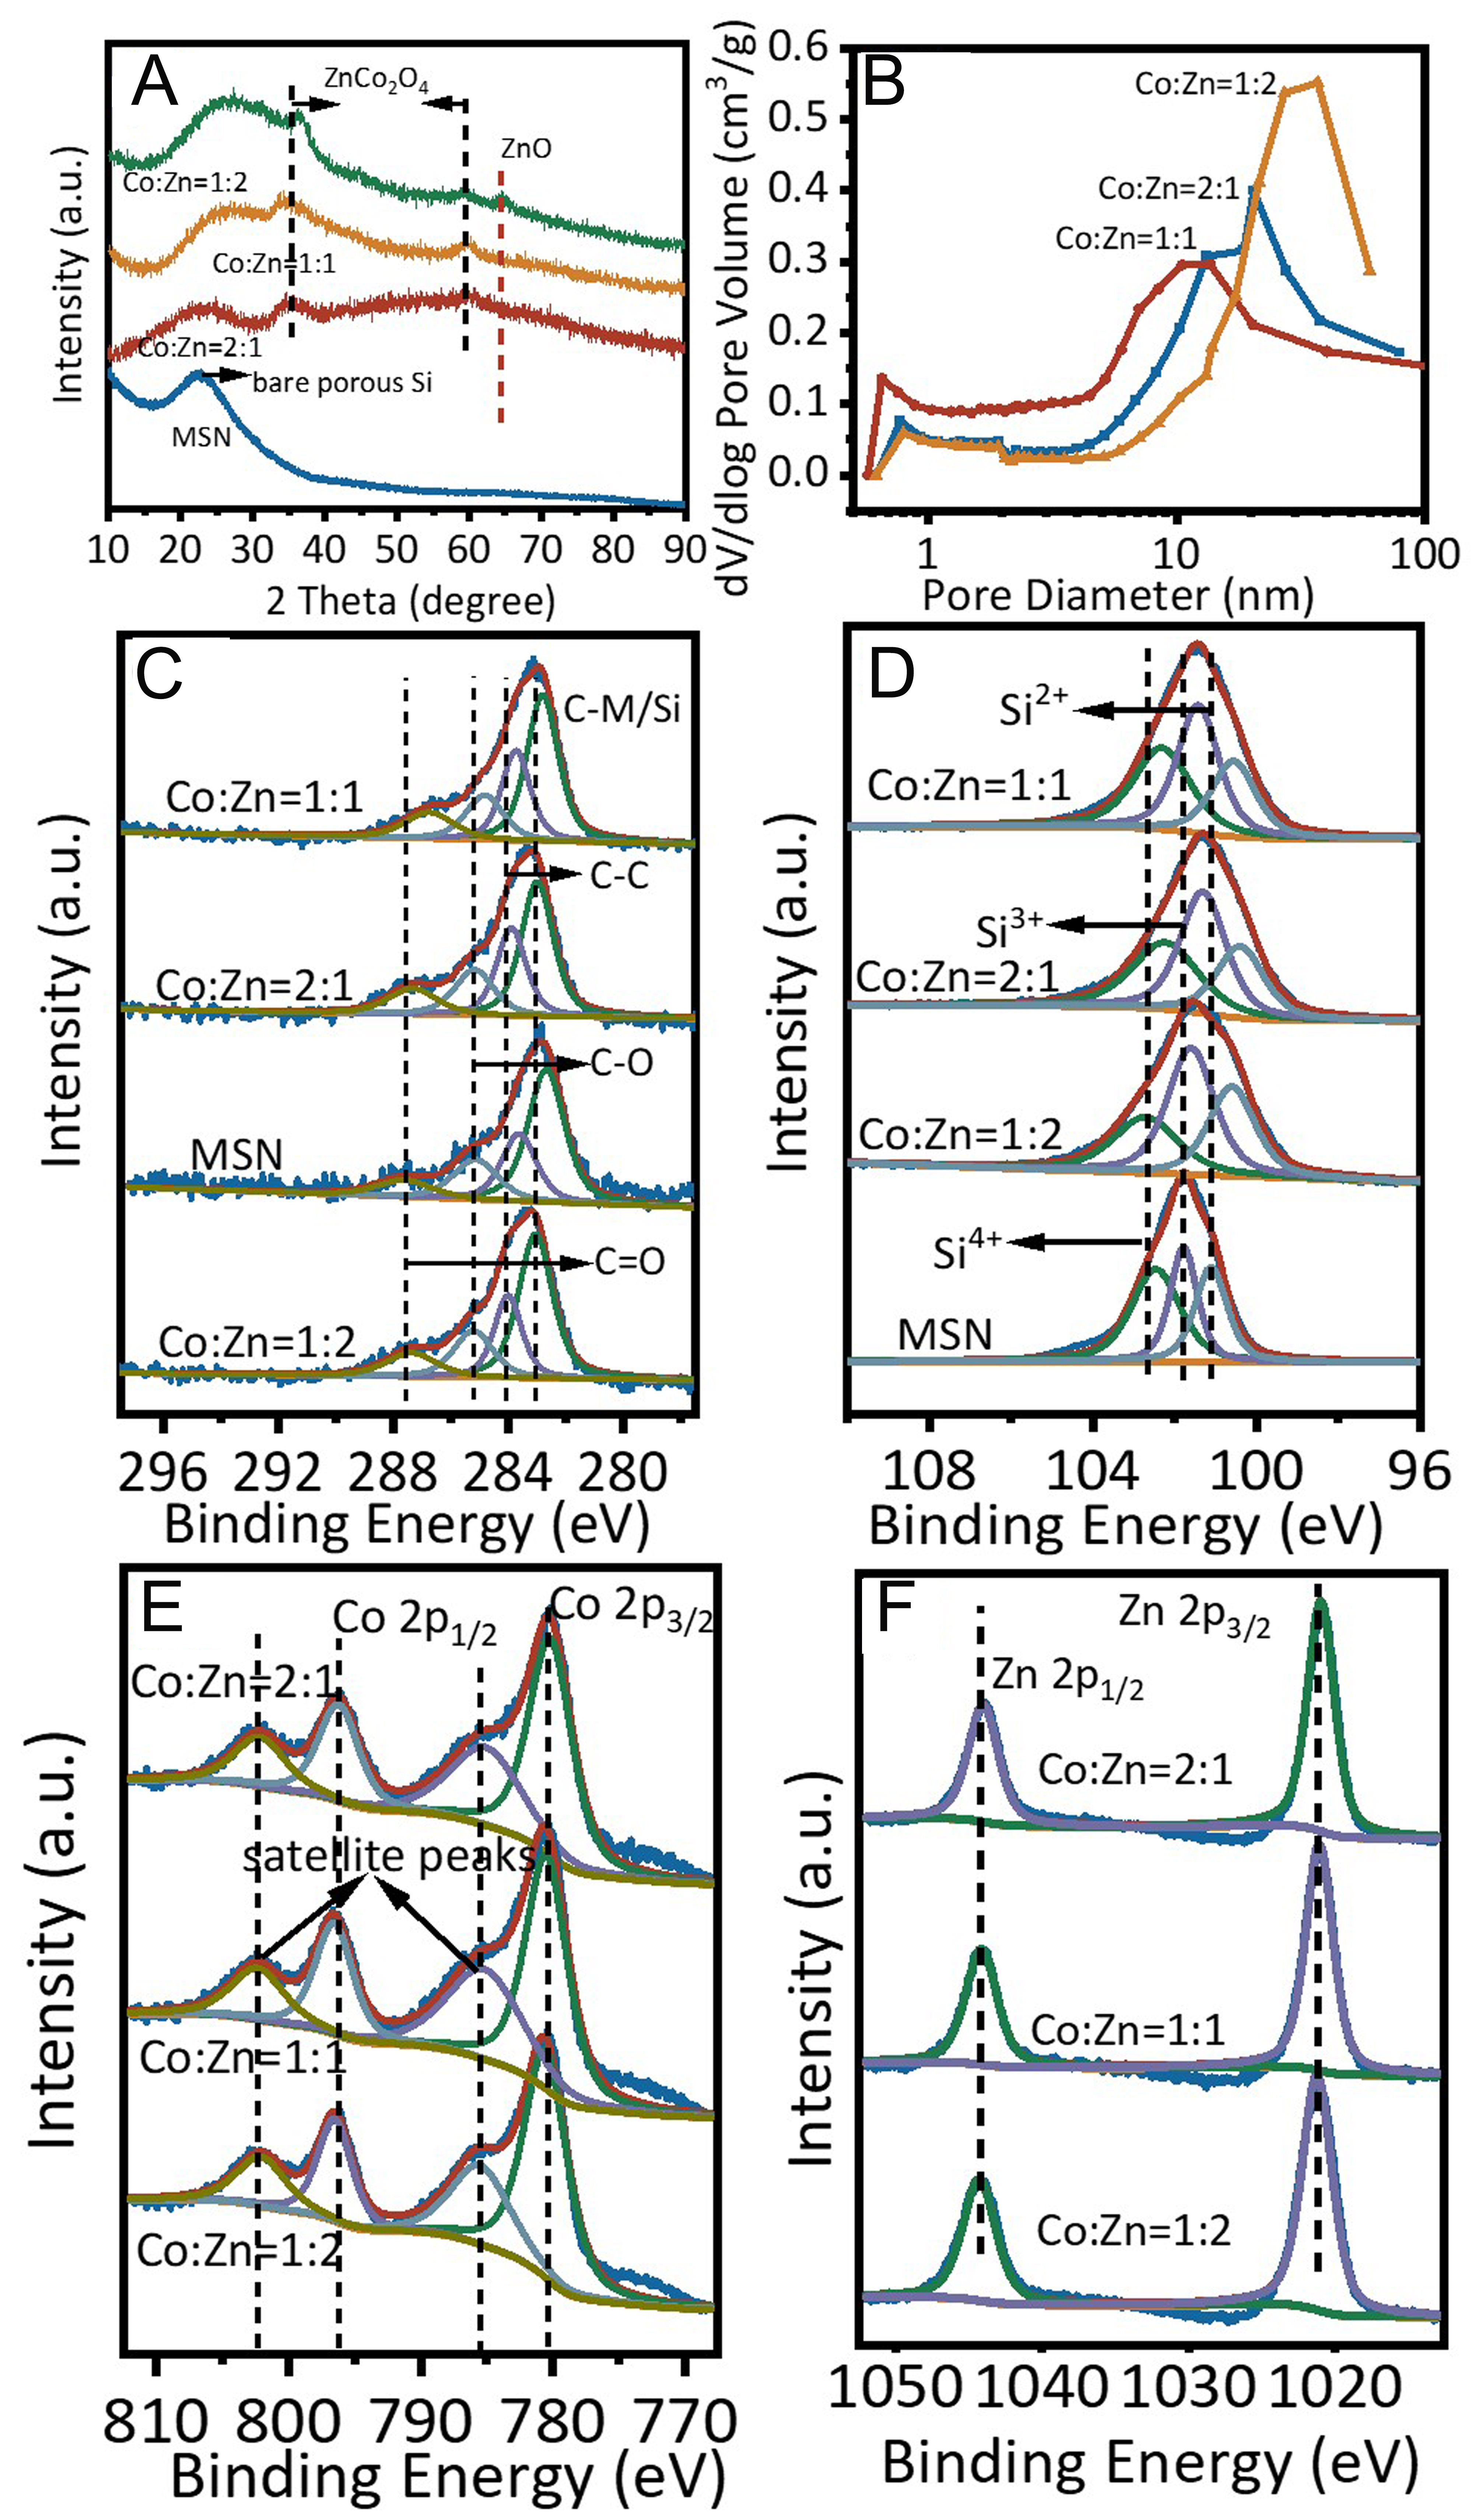
Figure 2. (A) XRD patterns of the three-dimensional flower-like hierarchical catalysts with varied Co/Zn molar ratios. (B) Pore size distribution curves derived from N2 adsorption-desorption isotherms for the corresponding three catalysts. (C-F) High-resolution XPS spectra of catalysts with different Co/Zn molar ratios: (C) C 1s, (D) Si 2p, (E) Co 2p, and (F) Zn 2p core levels.





