


fig7
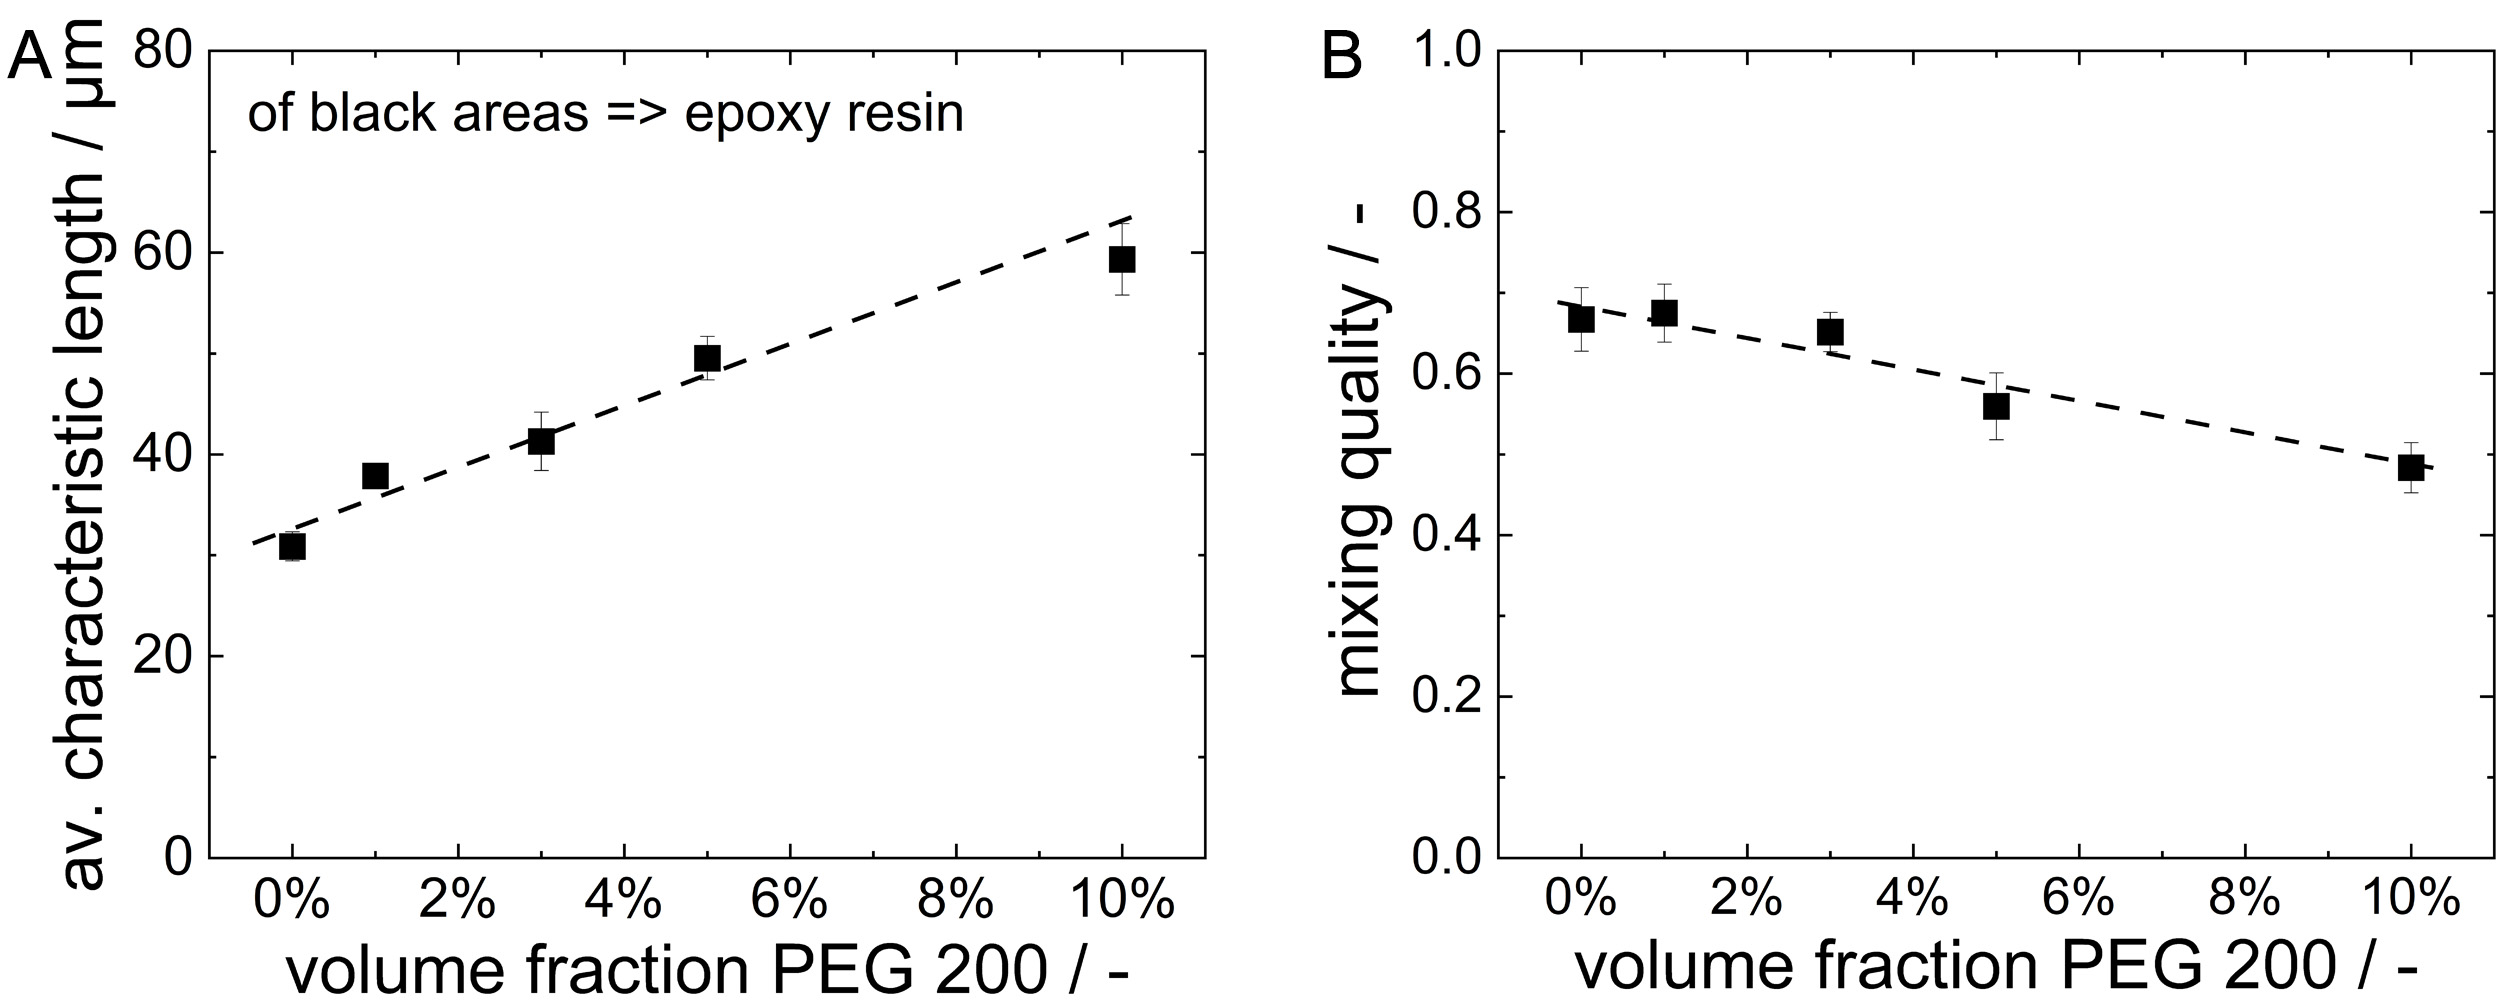
Figure 7. (A) Average characteristic length of the polymer-rich regions (black areas which represent the epoxy resin) and (B) mixing quality parameter (Eq. 4) as a function of PEG 200 content in ECAs containing 5 vol% silver. Dashed black lines are to guide the eye. The squares indicate the average values, and the error bars denote the standard deviation obtained from 4 images per formulation, as exemplarily shown in Figure 6. ECAs: Electrically conductive adhesives; PEG: polyethylene glycol.


