

fig5

Mitigating hydrogen evolution via ionomer structure for efficient CO<sub>2</sub> reduction in acidic membrane electrode assembly electrolyzers

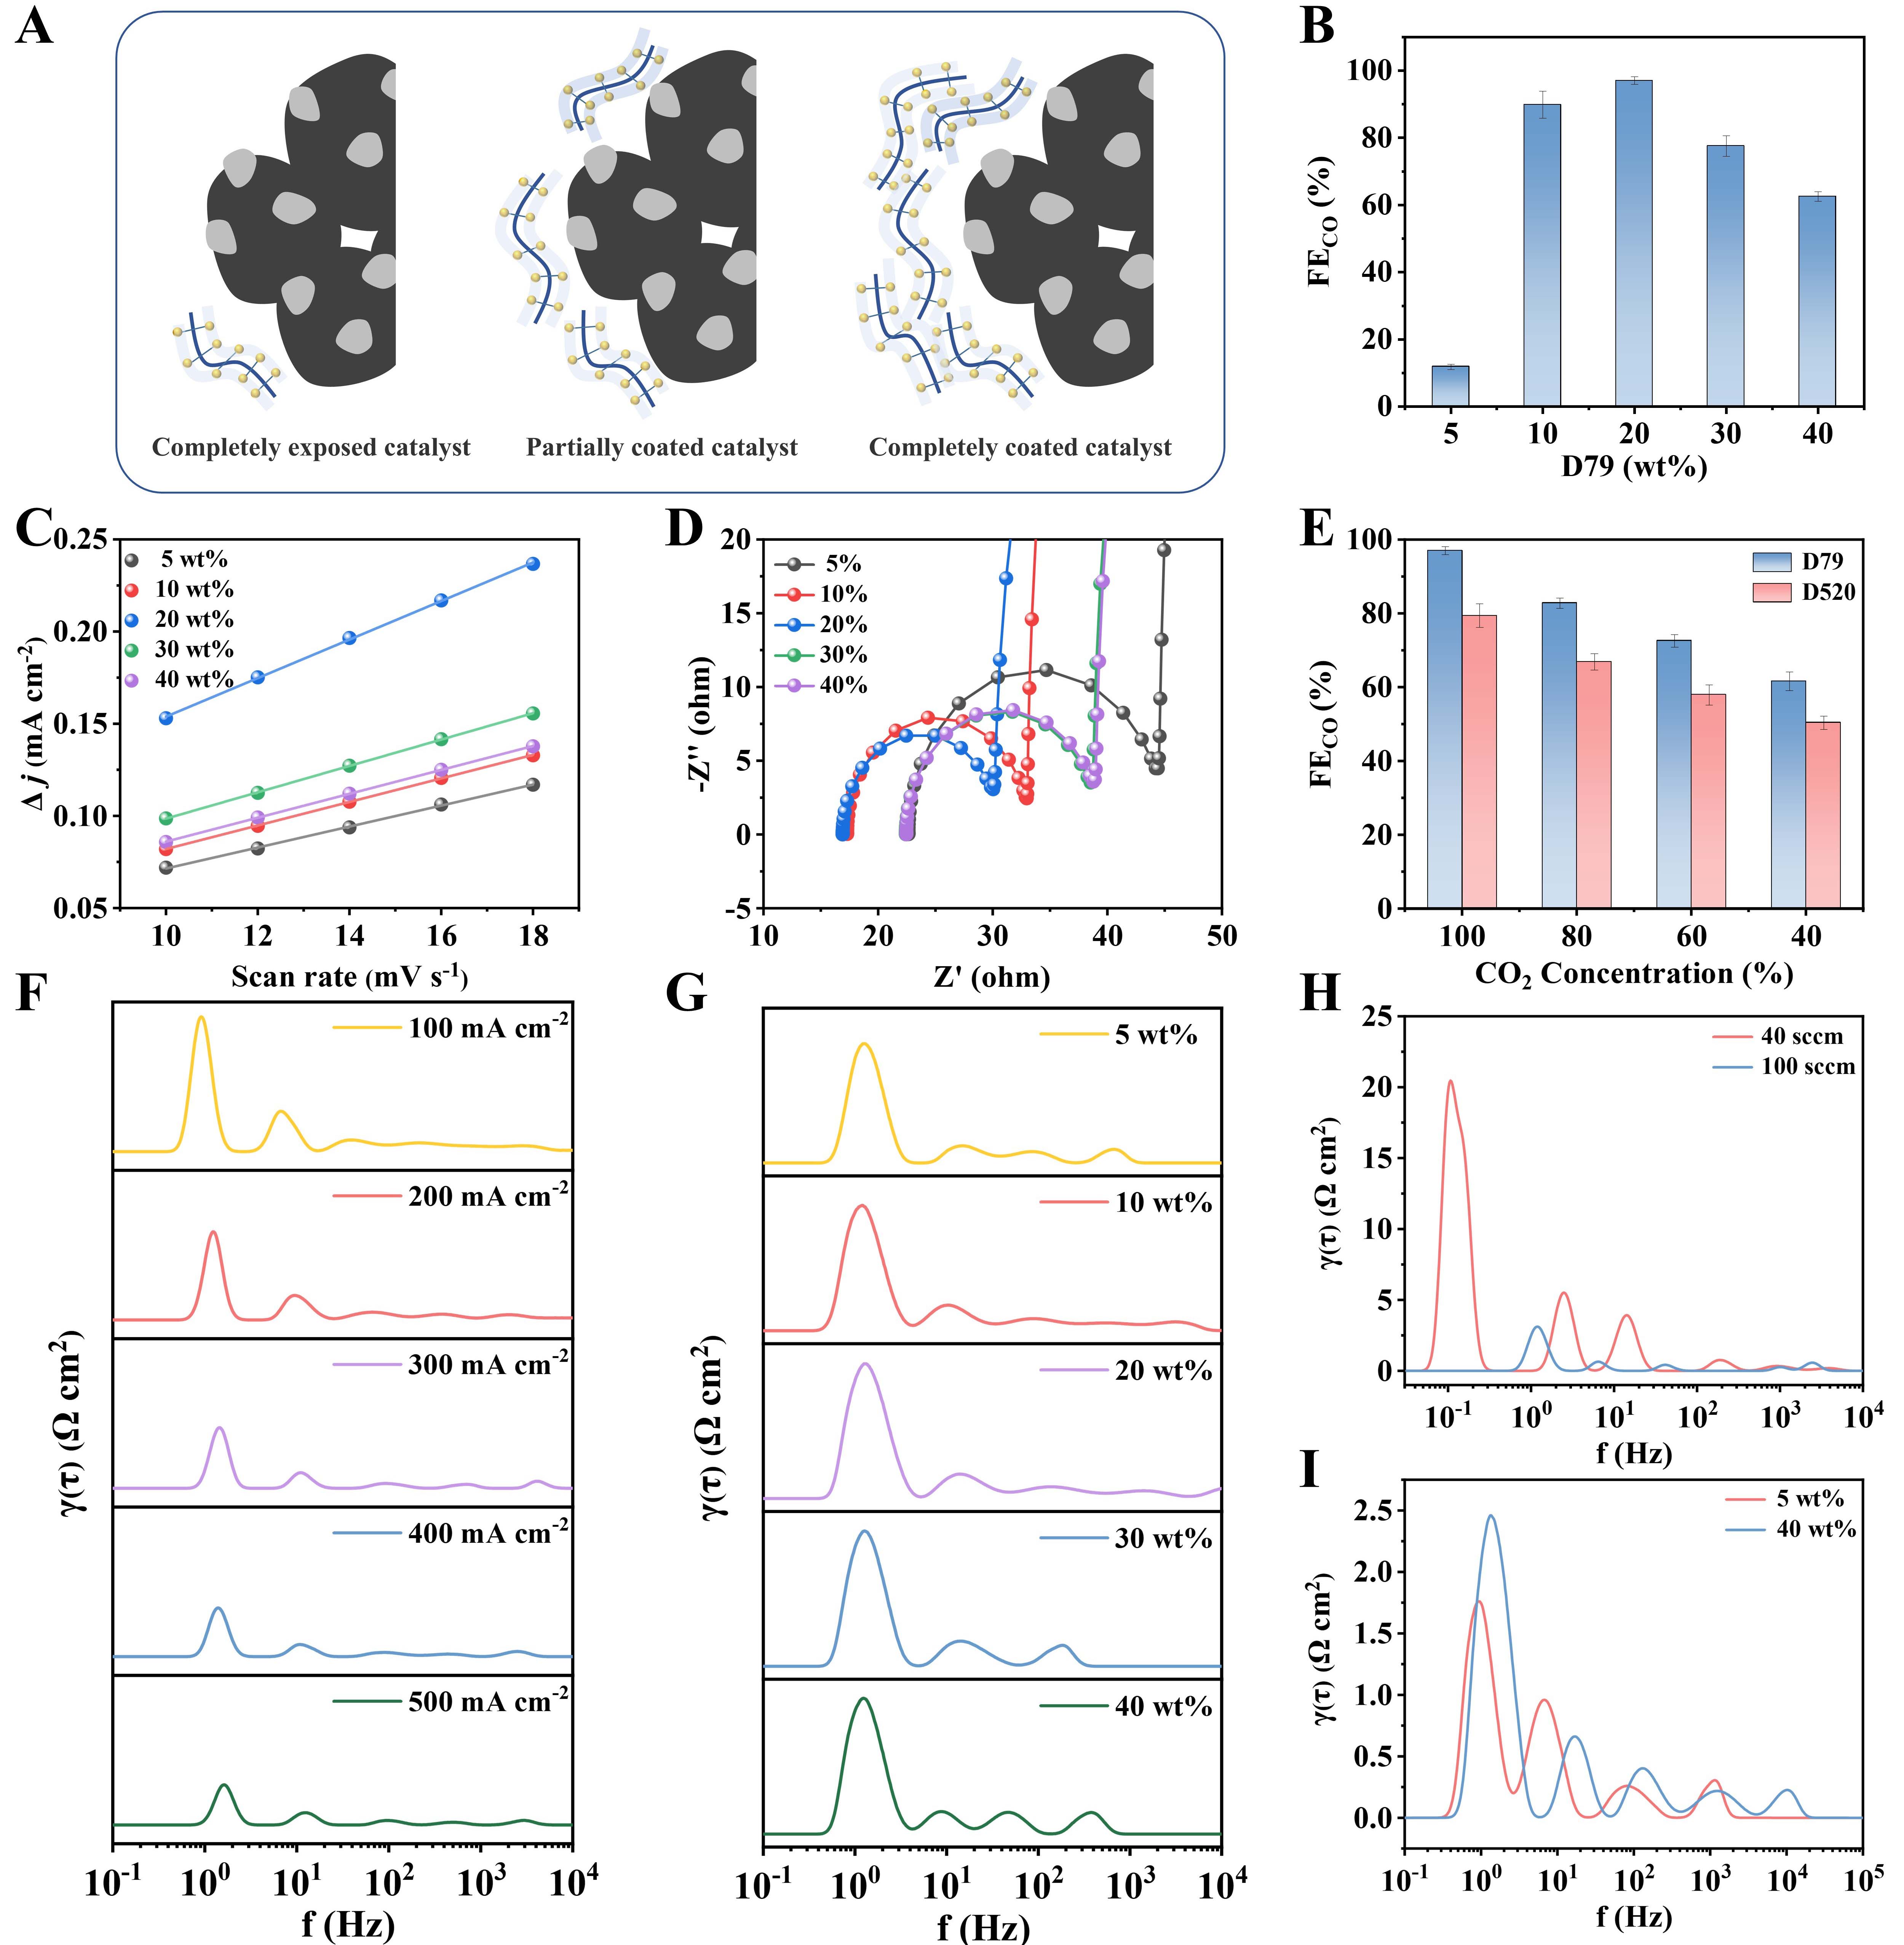
Figure 5. (A) Schematic illustration of the catalyst layer structure with varying ionomer ratio; (B) FECO of GDEs with varying ionomer ratio at 300 mA cm-2; (C) ECSA and (D) EIS of GDEs with varying ionomer ratio; (E) FECO of GDEs with D79 and D520 at different CO2 concentration; (F) DRT plot of GDE with 20 wt% D79 at 100-500 mA cm-2; (G) DRT plot of GDE with varying ionomer ratio at 300 mA cm-2; (H) DRT plot of GDE with 20 wt% D79 at varying flow rates at 300 mA cm-2; (I) DRT plot of GDE with 5wt% D79 and 40wt% D79 at 300 mA cm-2. Error bars represent the standard deviation from three independent measurements. Note that the x-axes in panels F-I are presented in logarithmic (Log10) scale.

Energy Materials
ISSN 2770-5900 (Online)
Follow Us

Portico

All published articles are preserved here permanently:

https://www.portico.org/publishers/oae/

Portico

All published articles are preserved here permanently:

https://www.portico.org/publishers/oae/




