

fig3
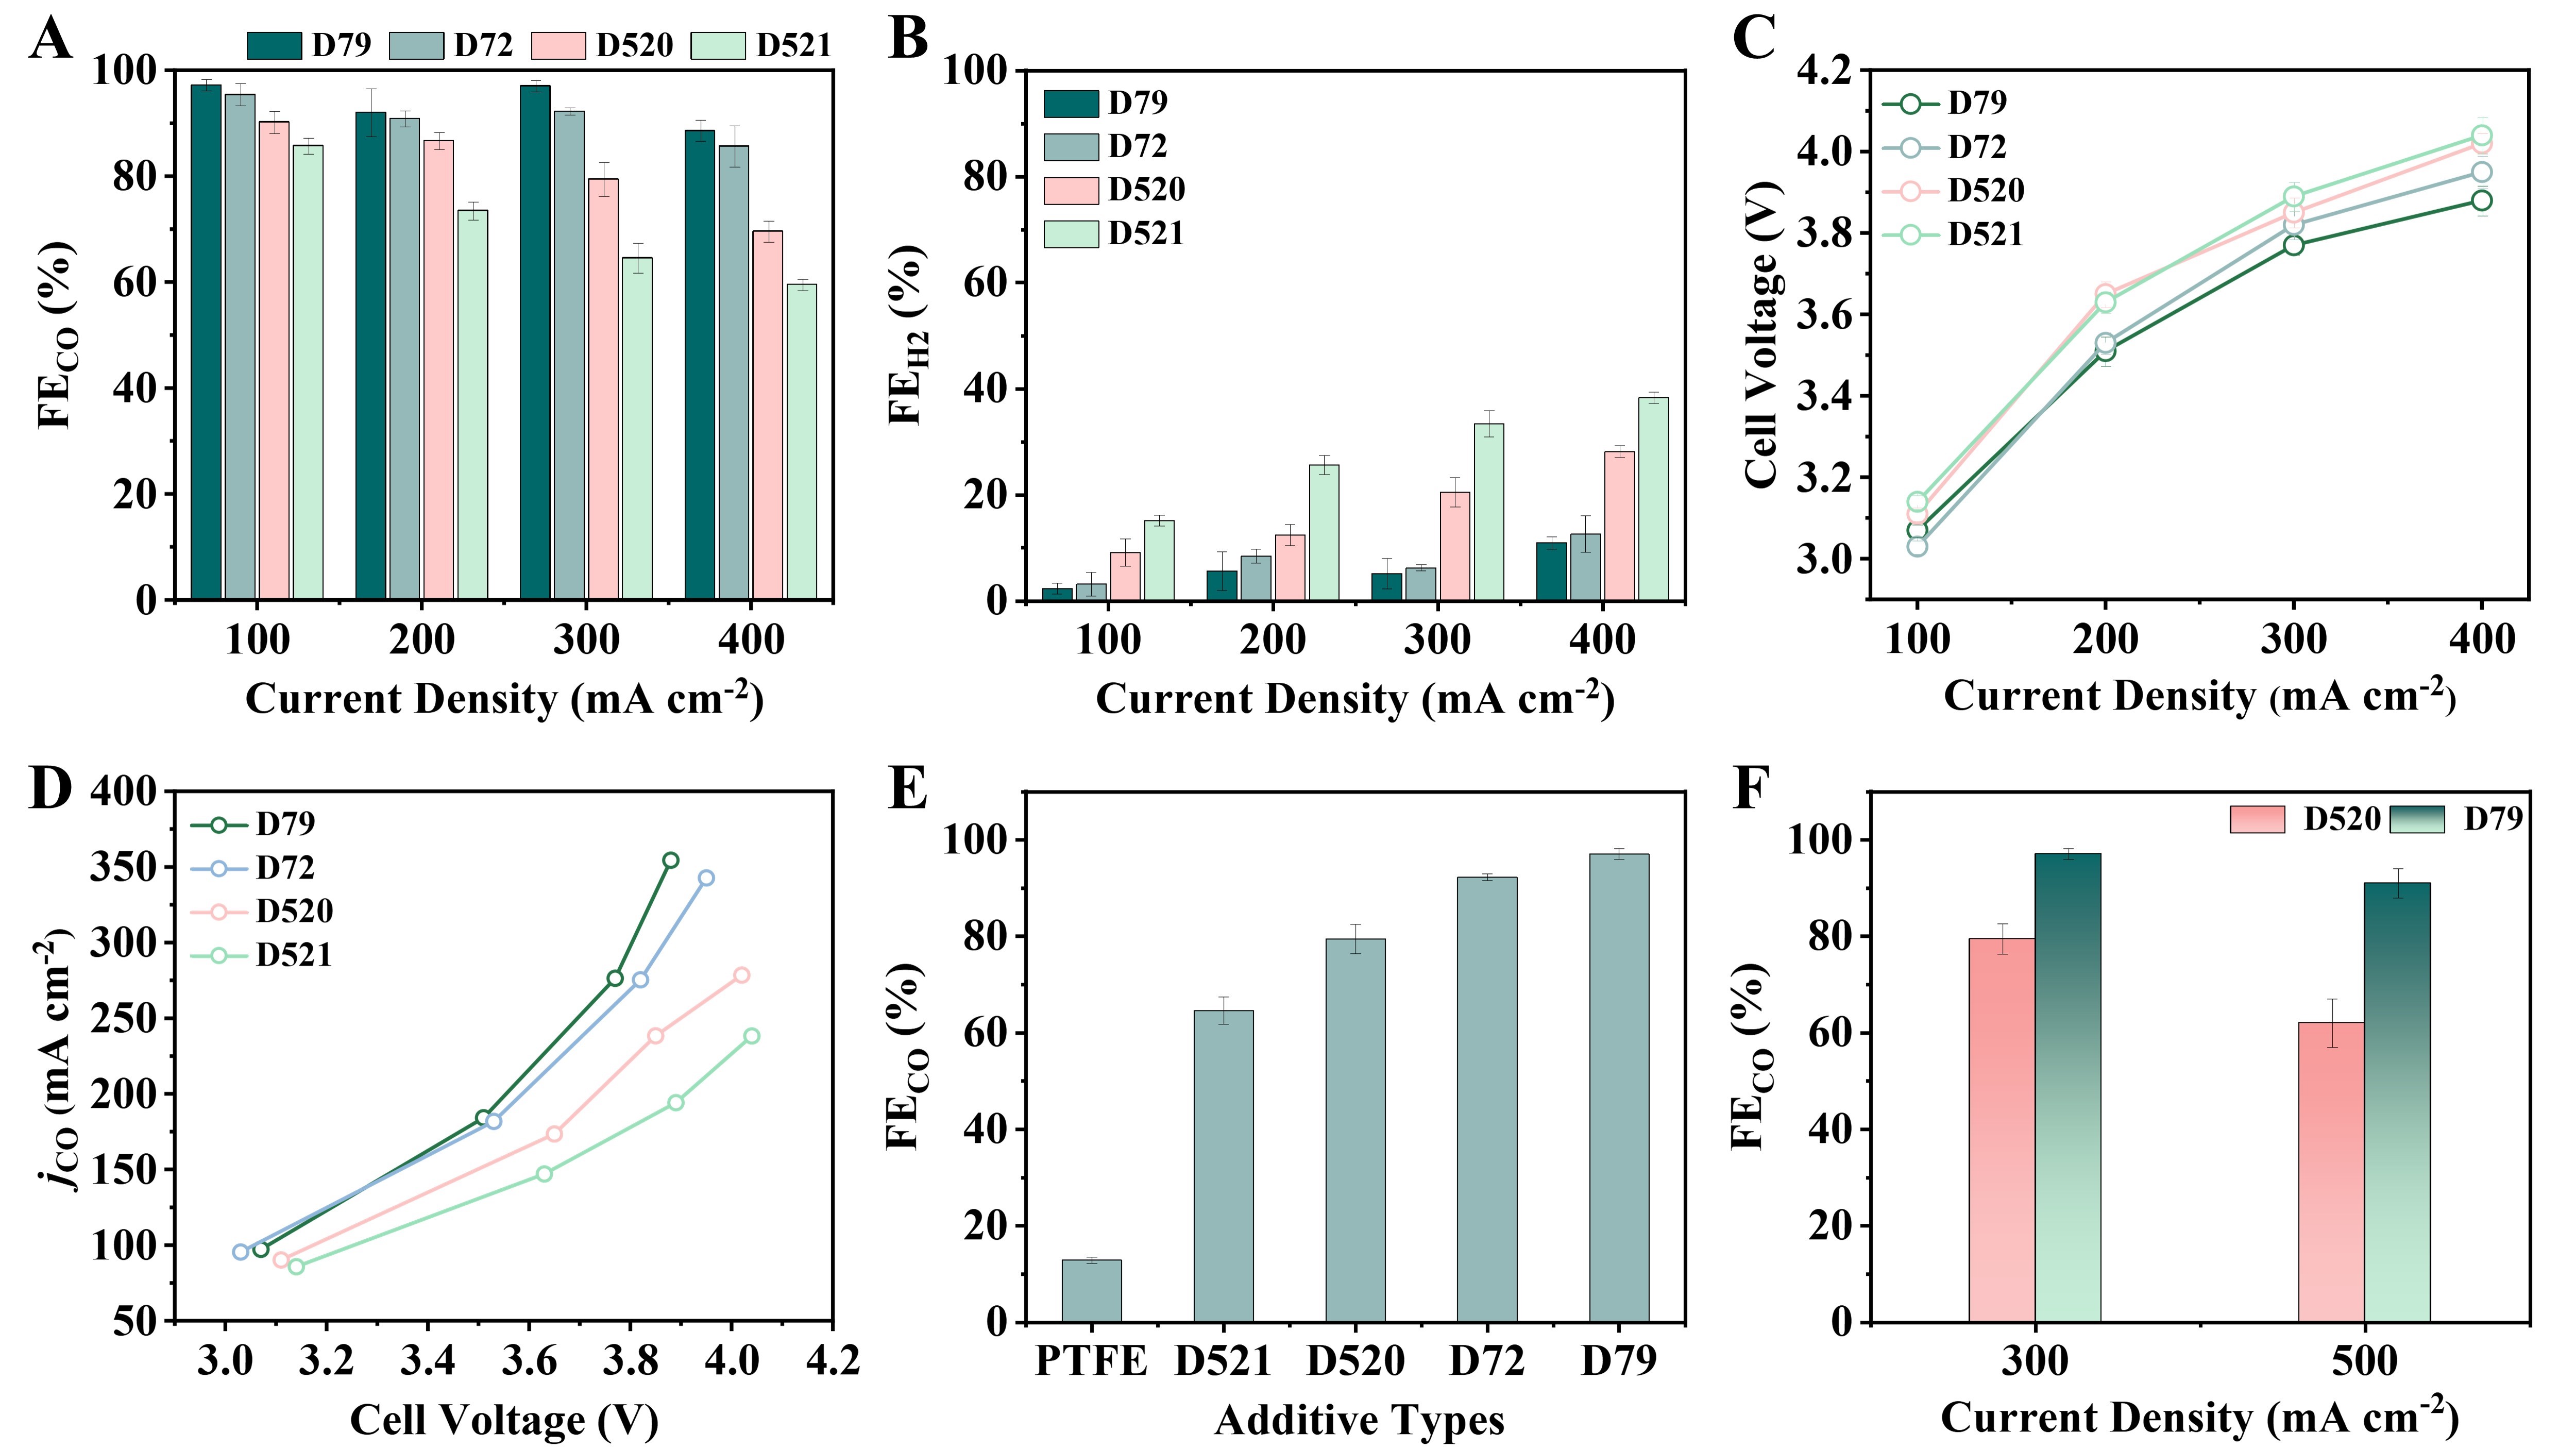
Figure 3. CO2 electroreduction performance of GDEs with different ionomers. (A) FECO, (B) FEH2, (C) Cell voltage, and (D) jCO of GDEs with D72, D79, D520, and D521 at various current densities; (E) FECO of GDEs with different ionomers (D72, D79, D520, D521) at 300 mA cm-2. The bar labeled PTFE represents a control GDE prepared without ionomer, using only PTFE as the binder. (F) FECO of GDEs with D79 and D520 at 500 mA cm-2. All ionomer-to-catalyst ratios were fixed at 20 wt% (I/C = 0.25). Error bars represent the standard deviation from three independent measurements.





