

fig1
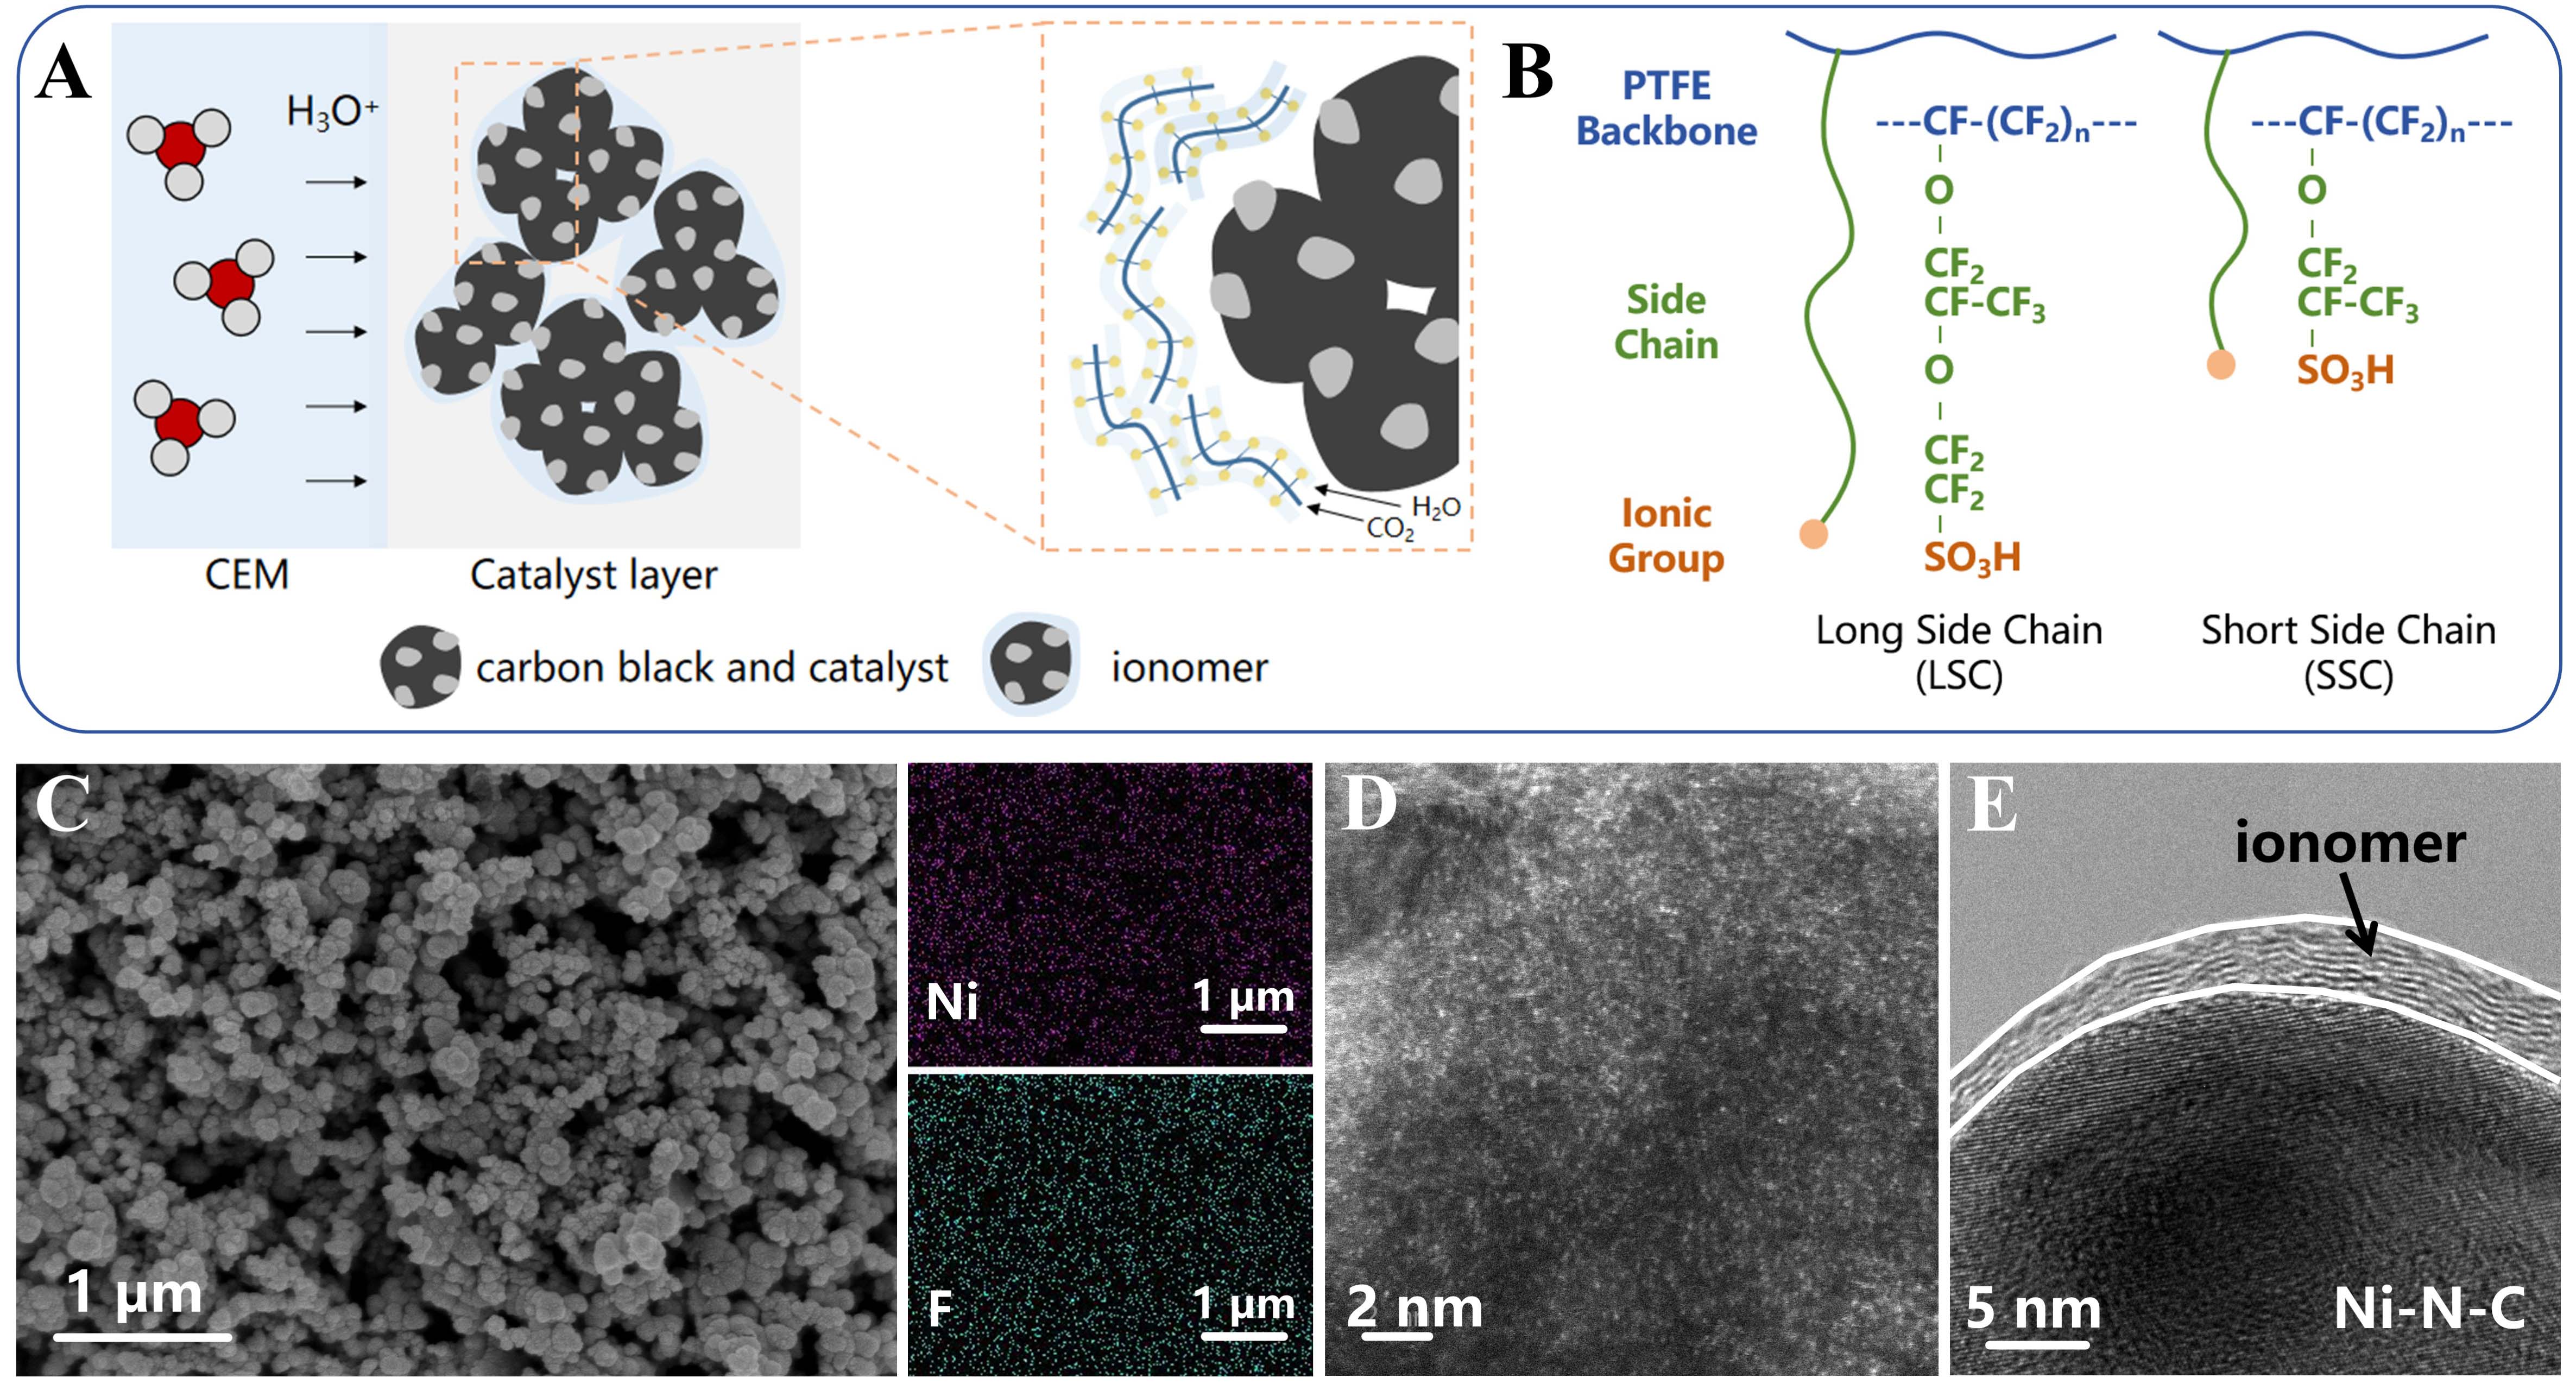
Figure 1. Morphology and structural characterization of the Ni-N-C catalyst. (A) Schematic illustration of ionomer and catalyst (red, gray, and yellow spheres correspond to oxygen atoms, hydrogen atoms, and sulfonic acid groups, respectively); (B) Chemical structure of PFSA ionomers; (C) SEM image and EDS mapping; (D) Aberration-corrected HAADF-STEM image; (E) TEM image.





