

fig2
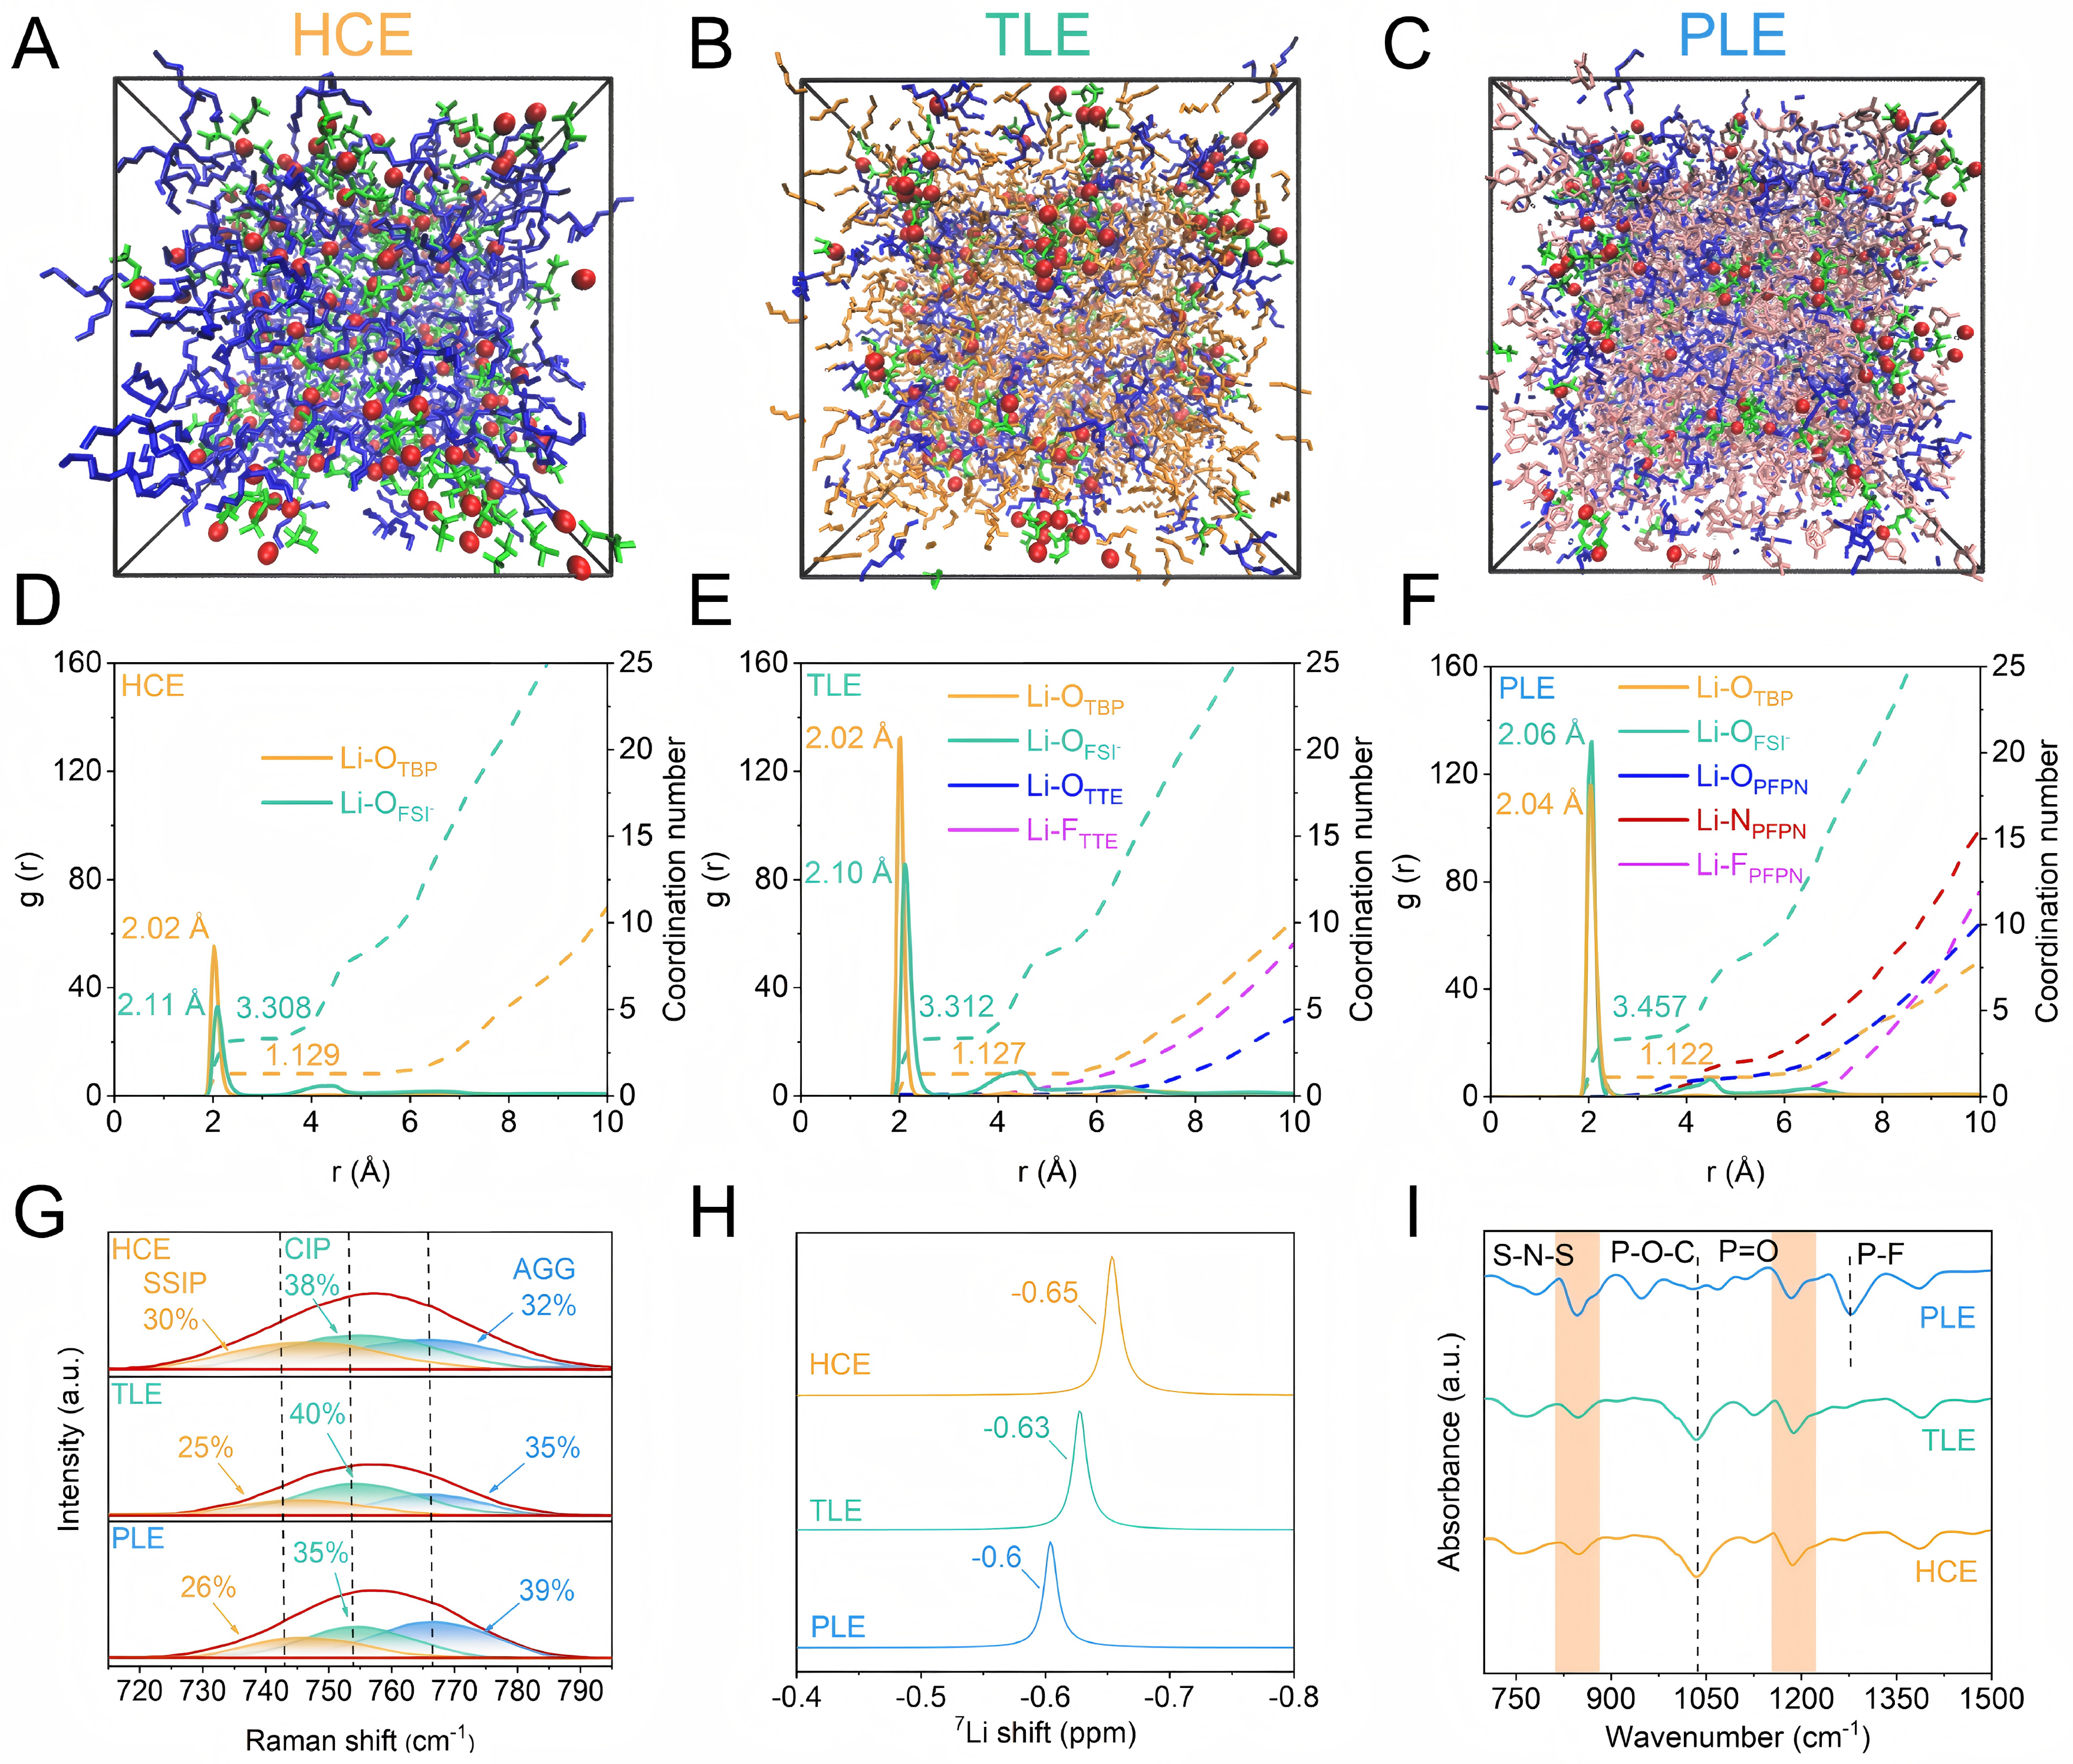
Figure 2. Solvation structure of electrolytes. MD simulation snapshots of (A) HCE, (B) TLE and (C) PLE. Radial distributions functions (RDF) and corresponding coordination of Li-OTBP, Li-OFSI-, Li-OPFPN, Li-NPFPN, and Li-FPFPN pairs calculated from MD simulation of (D) HCE, (E) TLE and (F) PLE. (G) Raman spectra of different electrolytes in the range of 720-790 cm-1. The peaks near 742, 754, and 766 cm-1 are assigned to SSIP, CIP, and AGG. (H) 7Li NMR spectra of various electrolytes. (I) FTIR spectra of HCE, TLE and PLE.





