

fig5
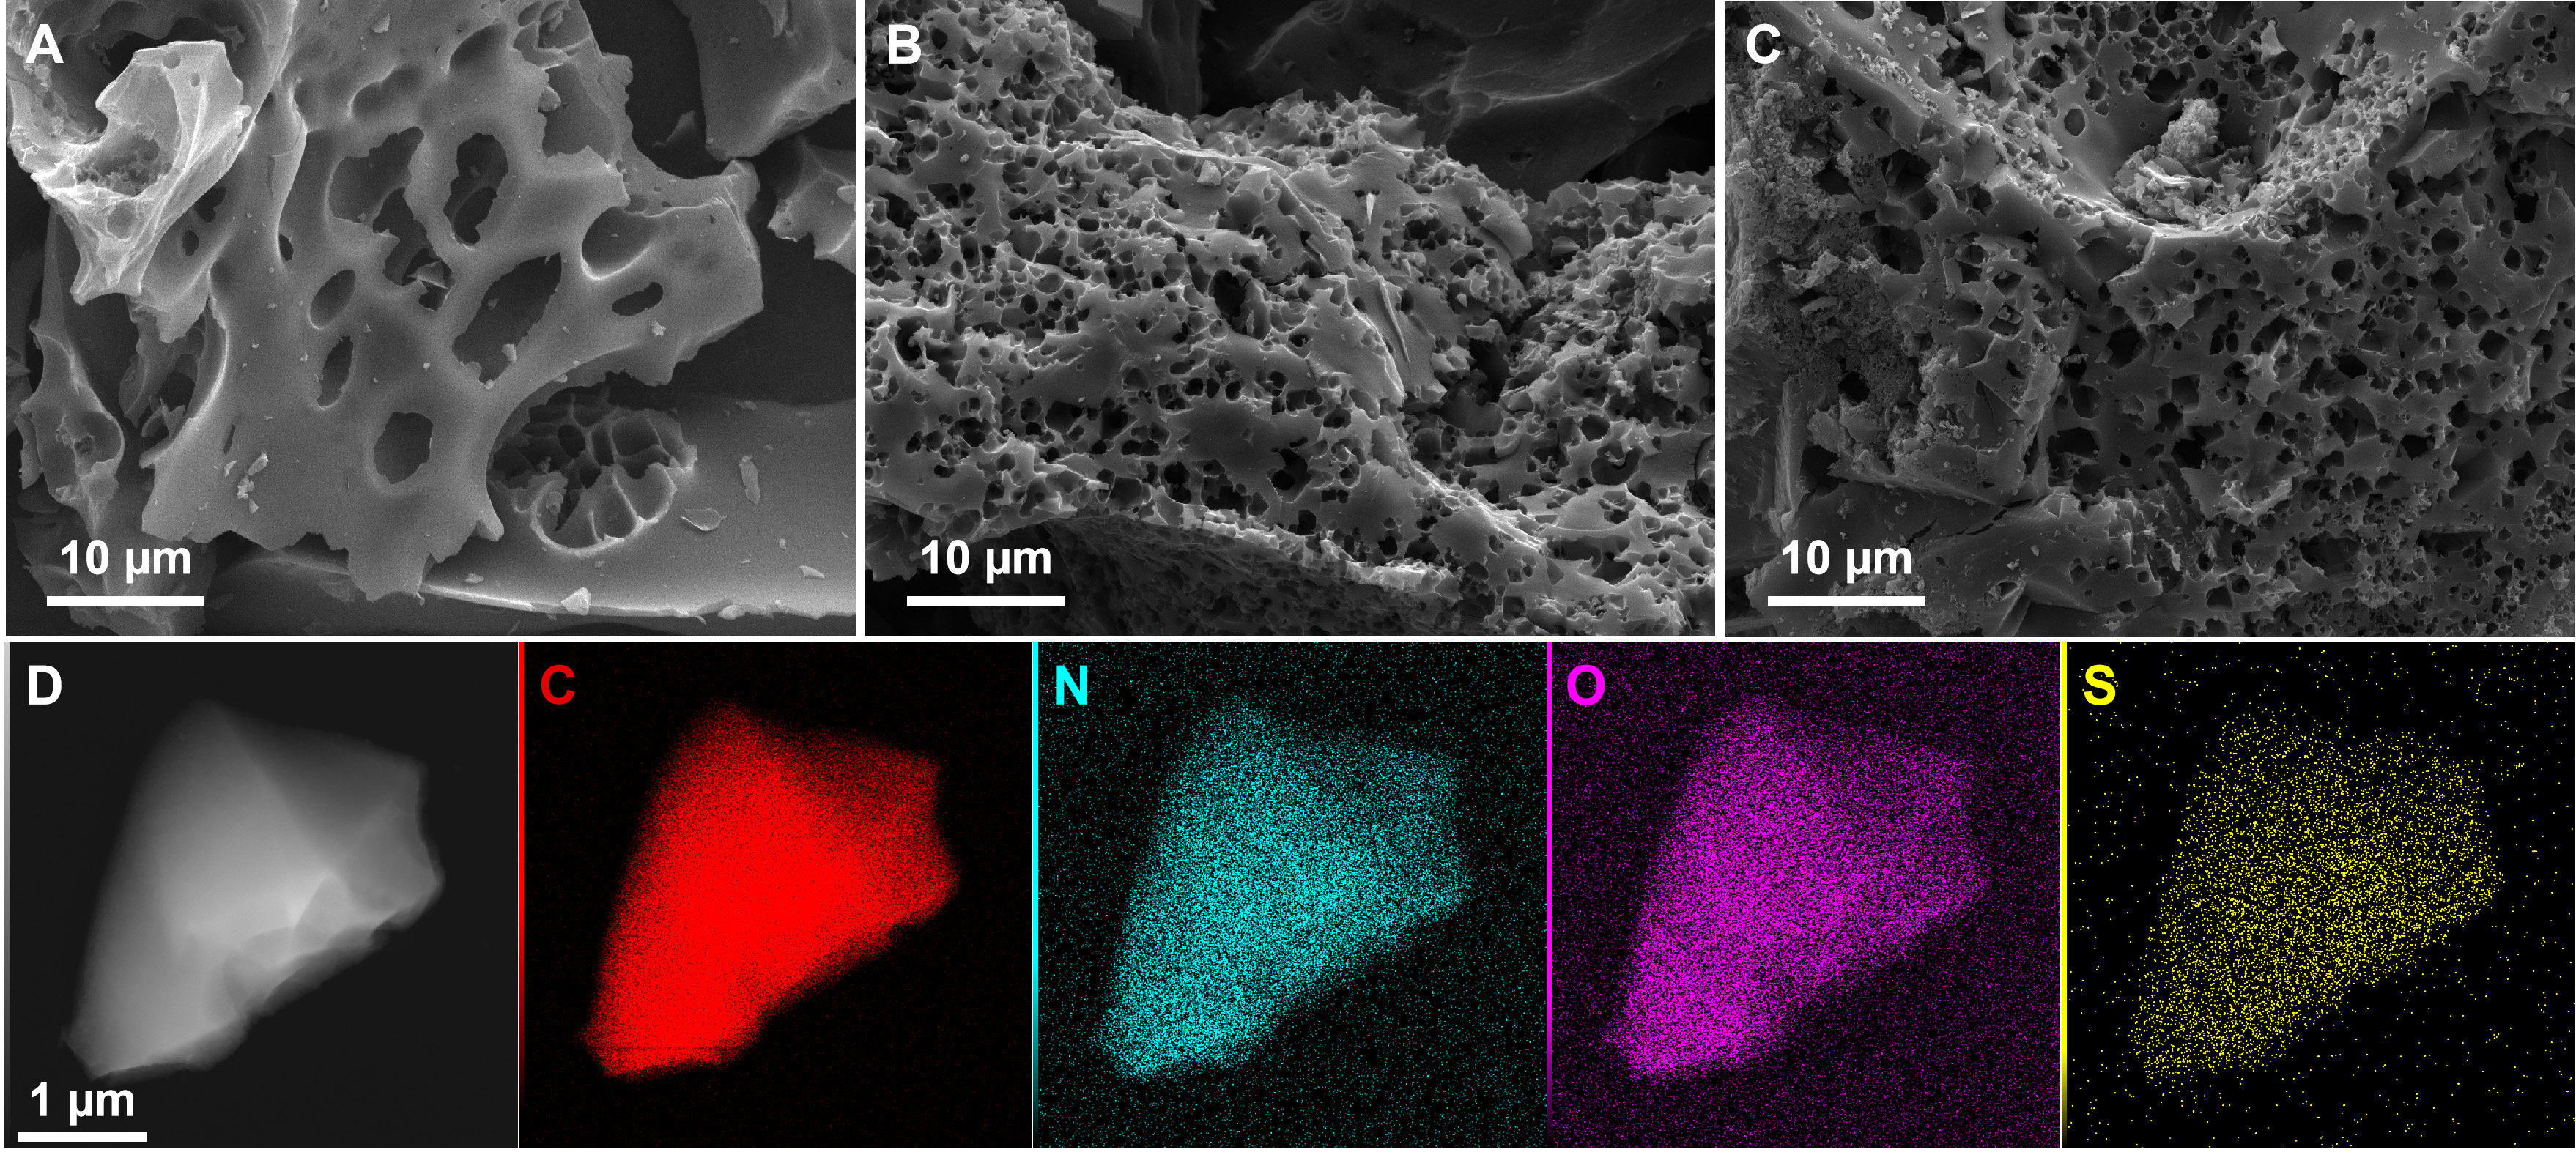
Figure 5. (A-C) SEM images of ACG-Suc, ACG-Gly, and ACG-Cys, respectively; (D) TEM image and corresponding elemental mappings of C, N, O, and S for ACG-Cys. SEM: Scanning electron microscopy; TEM: transmission electron microscopy; ACG: activated coffee grounds.





