


fig8
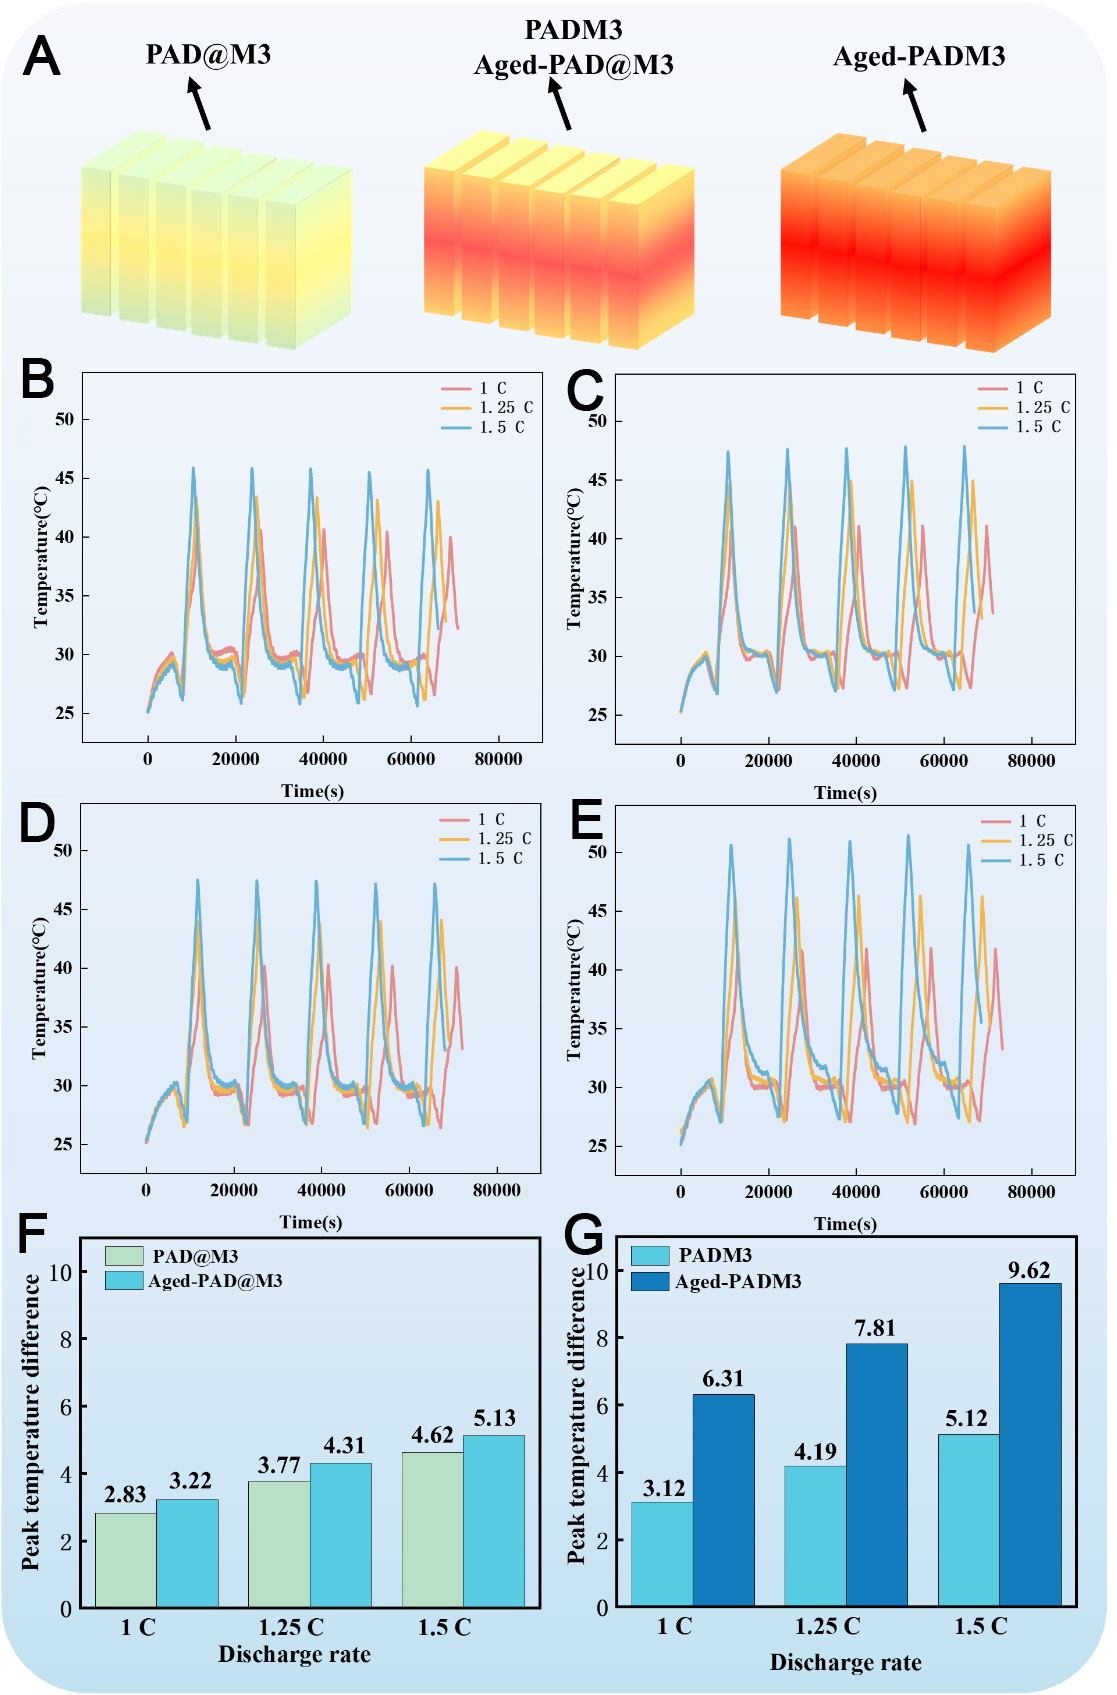
Figure 8. Battery thermal management performance: (A) schematic diagrams of the temperature distribution for different modules; Temperature curves of charge and discharge of the (B) PAD@M3 module; (C) PADM3 module; (D) Aged-PAD@M3 module; (E) Aged-PADM3 module; and (F and G) comparisons of the maximum temperature difference between fresh and aged modules. PAD@M: PEG2000/ER/EG/AD@MCA; PADM: PEG2000/ER/EG/APP/DPER/MCA.


