


fig5
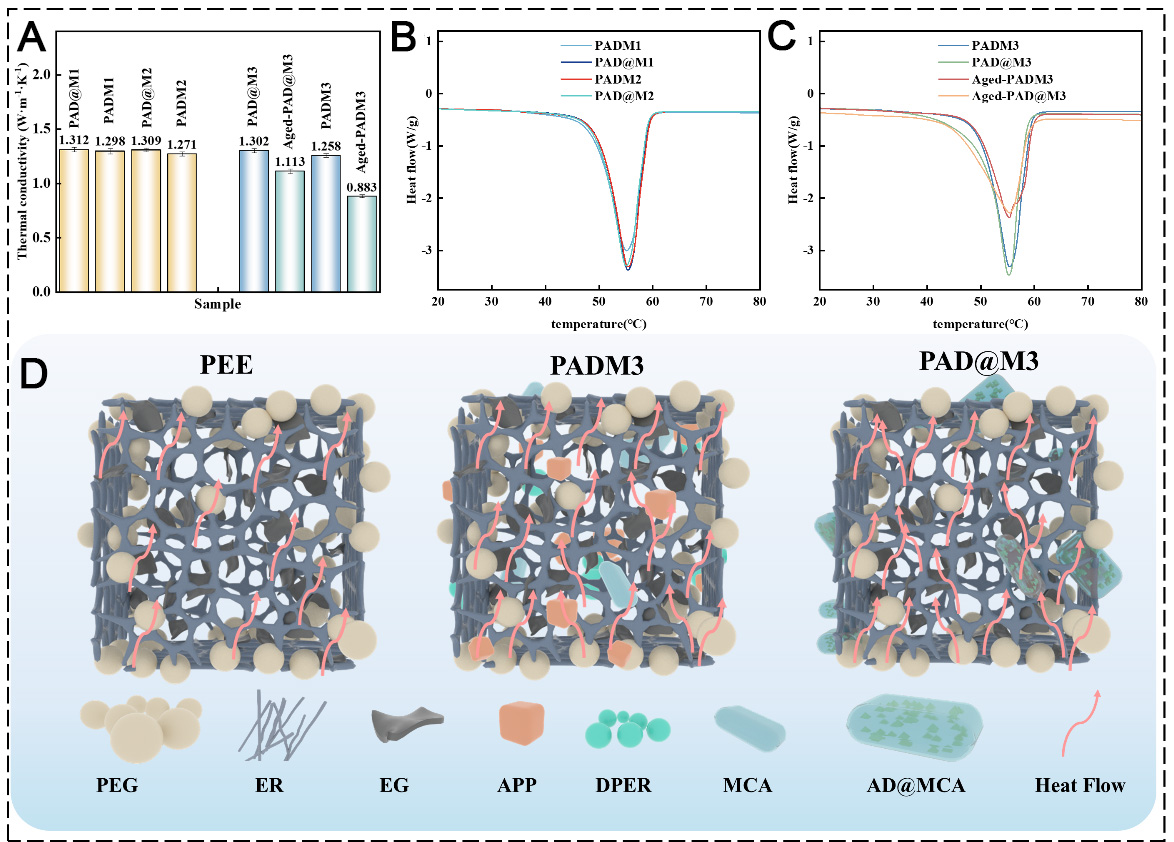
Figure 5. (A) Thermal conductivity of different CPCM samples. Error bars represent the standard deviation (SD) of five independent measurements performed for each sample, (B) DSC heating curves and (C) cooling curves of different CPCM, (D) Schematic diagrams of the heat conduction mechanisms in PEE, PADM3, and PAD@M3. CPCM: Composite phase-change material; PEG: polyethylene glycol; ER: epoxy resin; EG: expanded graphite; ammonium polyphosphate; DPER: dipentaerythritol; MCA: melamine cyanurate; AD: ammonium polyphosphate and dipentaerythritol; DSC: differential scanning calorimeter; PEE: PEG2000/ER/EG.


