


fig5
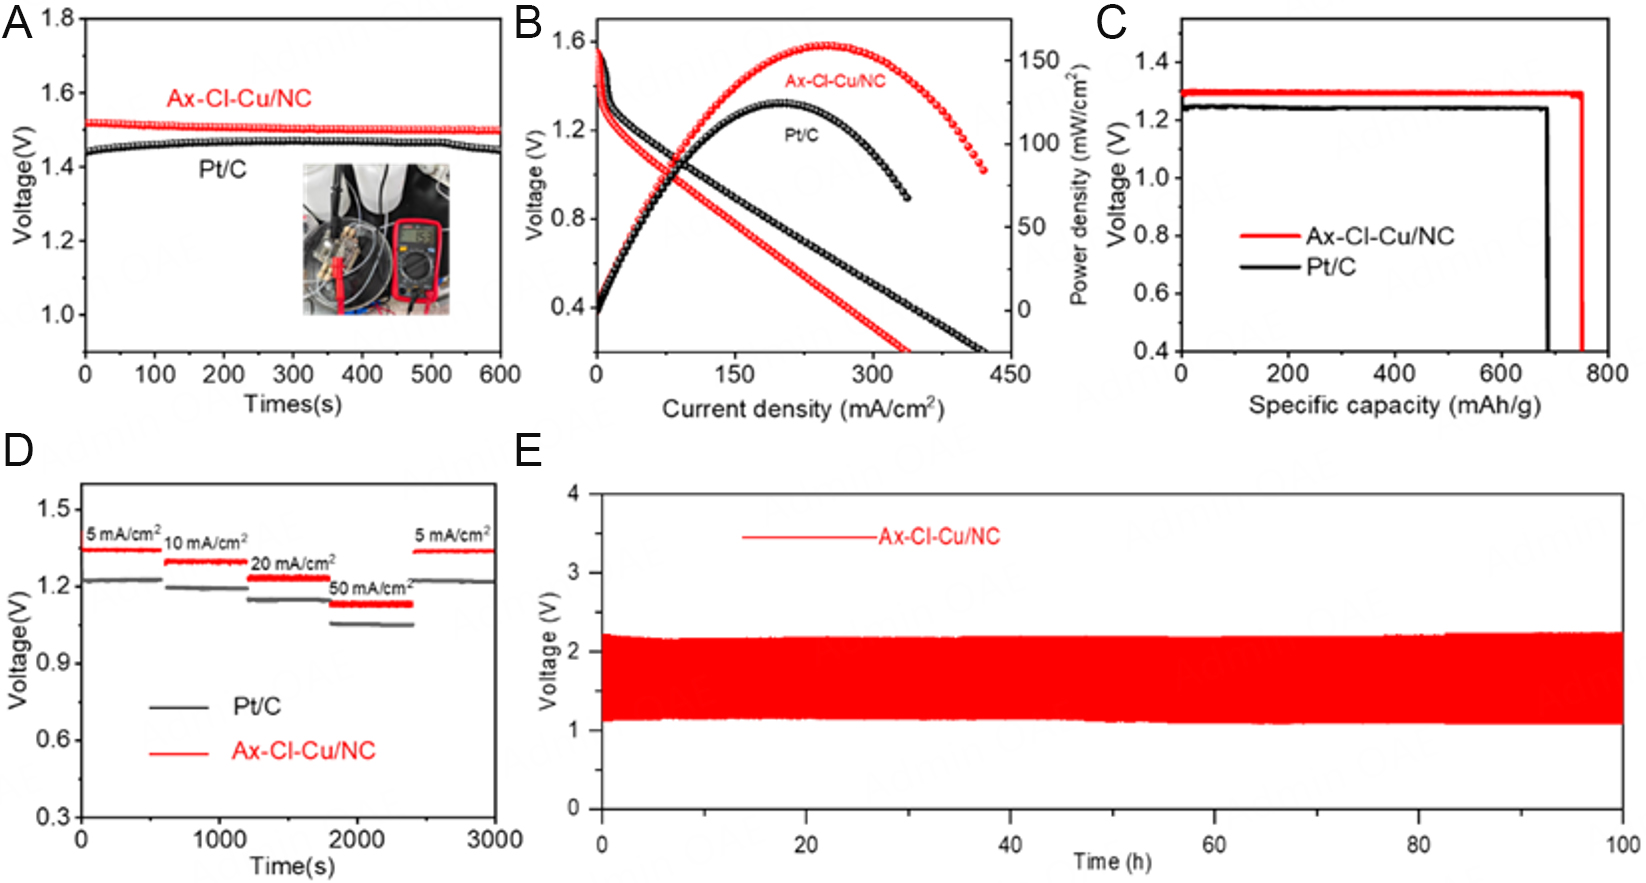
Figure 5. Performance diagram of assembling Zn air battery. (A) Open-circuit voltage plots, (B) Discharge polarization curve and power density plots, (C) specific capacity at current density of 10 mA cm-2, (D) Diagram of galvanostatic discharge curves at different currents of Ax-Cl-Cu/NC and Pt/C, (E) Galvanostatic discharge-charge cycling curve performed under 5 mA cm-2 for the Ax-Cl-Cu/NC based ZABs.


