


fig3
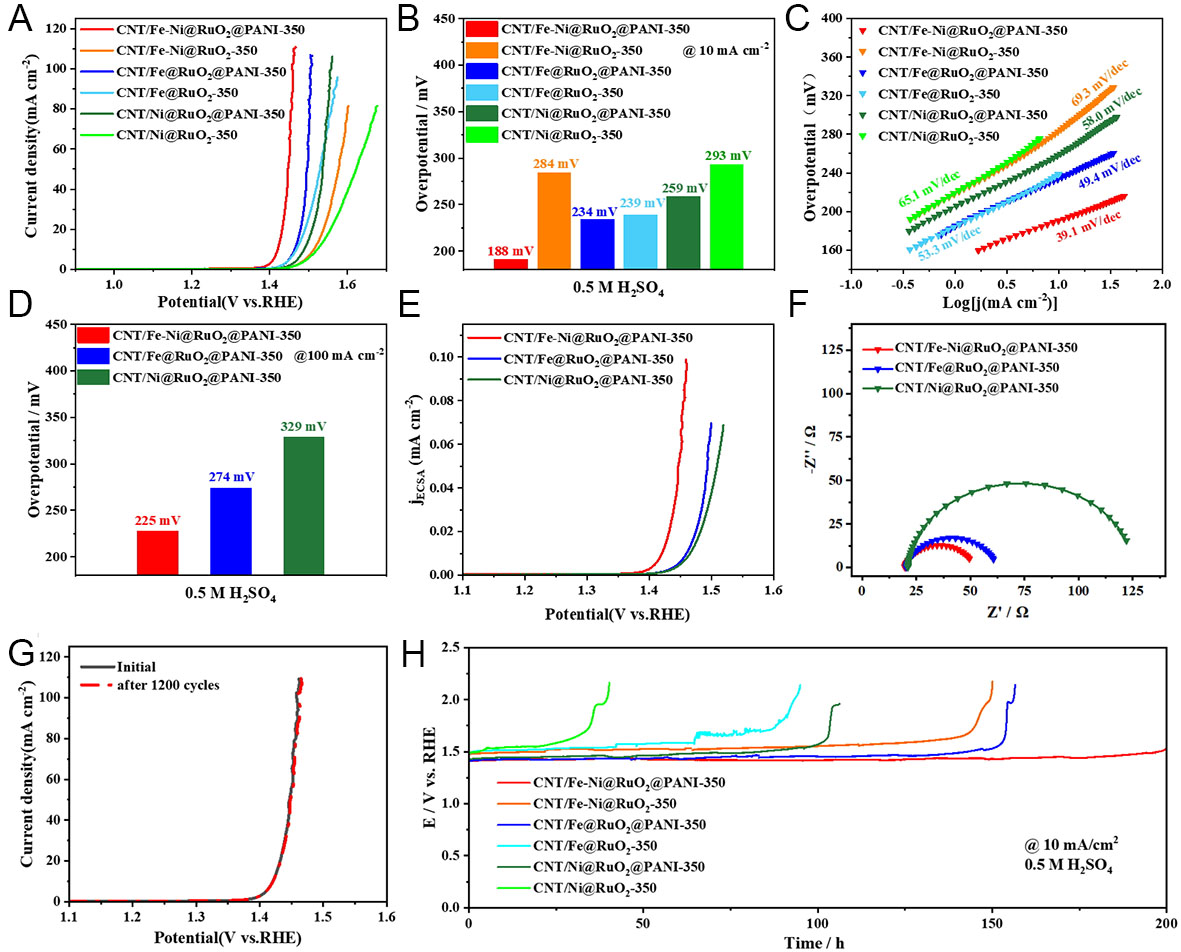
Figure 3. OER catalytic performance of different catalysts in 0.5 M H2SO4 solution. (A) OER polarization curves, (B) overpotentials at a current density of 10.0 mA cm-2, (C) Tafel plots, (D) overpotentials at a current density of 100.0 mA cm-2, (E) ECSA-normalized polarization profiles, (F) EIS spectra, (G) polarization profiles of CNT/Fe-Ni@RuO2@PANI-350 before and after OER, (H) time-dependent potential curves.


